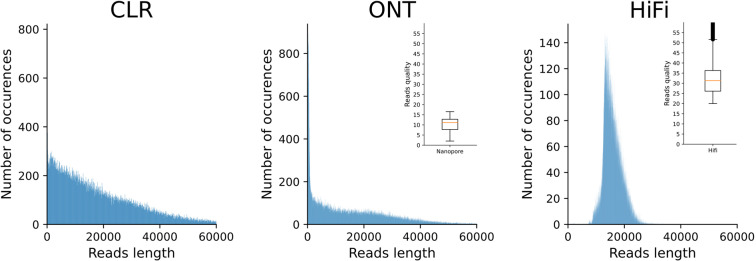
Fig. 3.
Plot of the length and quality of our long reads datasets. The main graph of each technologies shows the histogram of size distribution from the randomly chosen 100 000 reads, in the corner of this graph is a boxplot of the quality of theses reads. Metrics are based on fastq file output and are technology dependent. CLR quality is not computed during fastq production and therefore not exploited. HiFi quality is not phred-score based.

