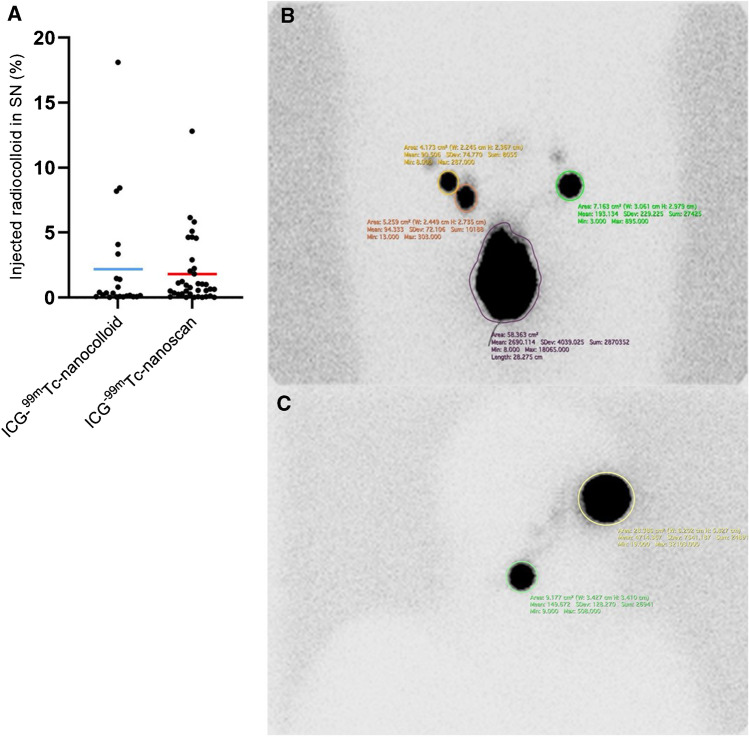
Fig. 2.
The uptake of injected radiocolloid in SNs on planar lymphoscintigraphy. A There is no difference in uptake when ICG-99mTc-nanocolloid (blue line) and ICG-99mTc-nanoscan (red line) are compared. B Example of analyses in Horos in a patient with PeCa; ROIs around the injection site (purple circle) and SNs (green, orange and yellow circles). C And the analysis of a patient with melanoma; ROIs around the injection site (yellow circle) and SNs (green circle)

