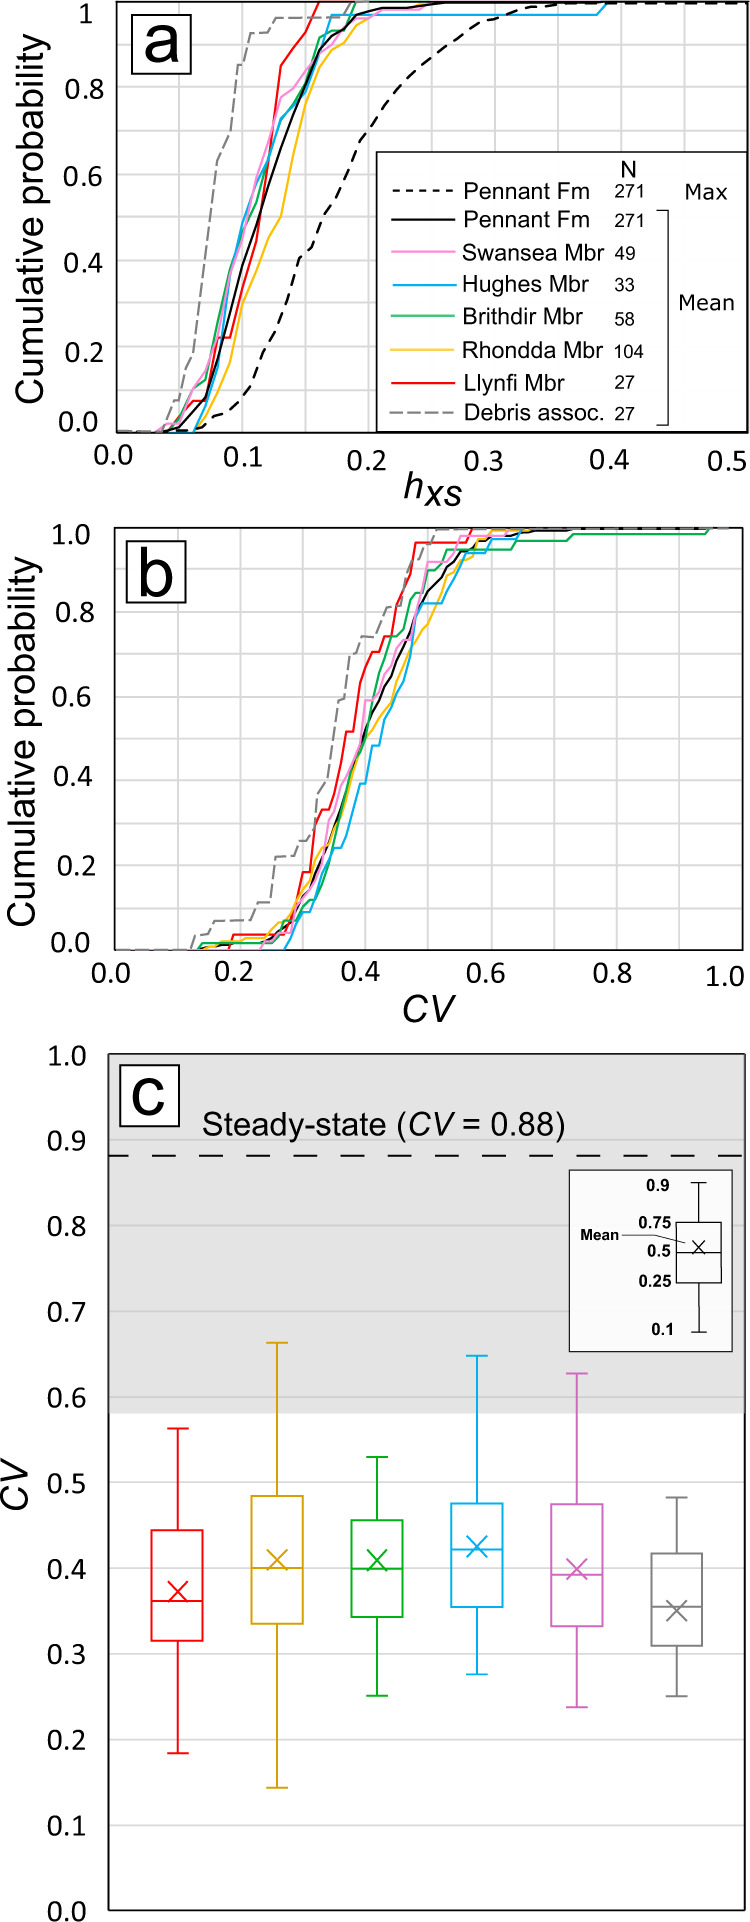
Fig. 3. Cross-set data demonstrating disequilibrium bedform preservation.

a Cumulative probability distributions of mean cross-set height for each member of the Pennant Formation, with distributions of the mean, 84th percentile, maximum for the Pennant Formation overall, and cross-sets associated with woody debris; b similar to (a), but with distributions of CV; c the CV of cross-set height for each member of the Pennant Formation. The dashed line and grey shaded region indicate the theoretical and empirical range of CV at steady state of 0.88 ± 0.321,22, and the grey box represents cross-sets associated with woody debris.
