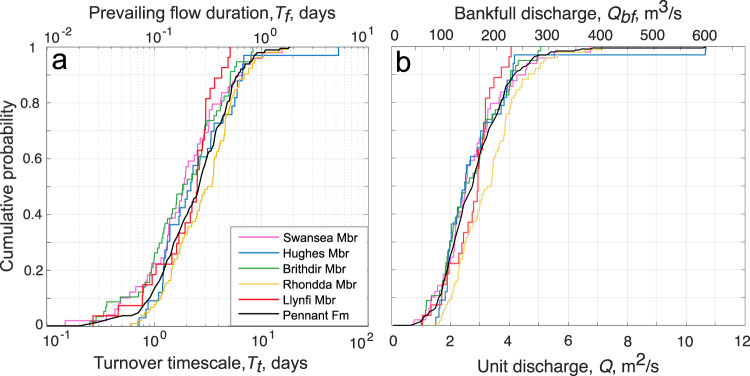
Fig. 4. Cumulative probability distribution graphs showing key palaeohydrological variables.
a The primary x-axis represents bedform turnover timescale, Tt, in each member of the Pennant Formation, and the secondary x-axis indicates prevailing flow duration, Tf, which we set as 0.1Tt, following Leary and Ganti13; b the primary x-axis represents the unit discharge, Q, and the secondary x-axis represents the bankfull discharge, Qbf, calculated by multiplying Q by the average width of the channel, 55 m28.

