Figure 1.
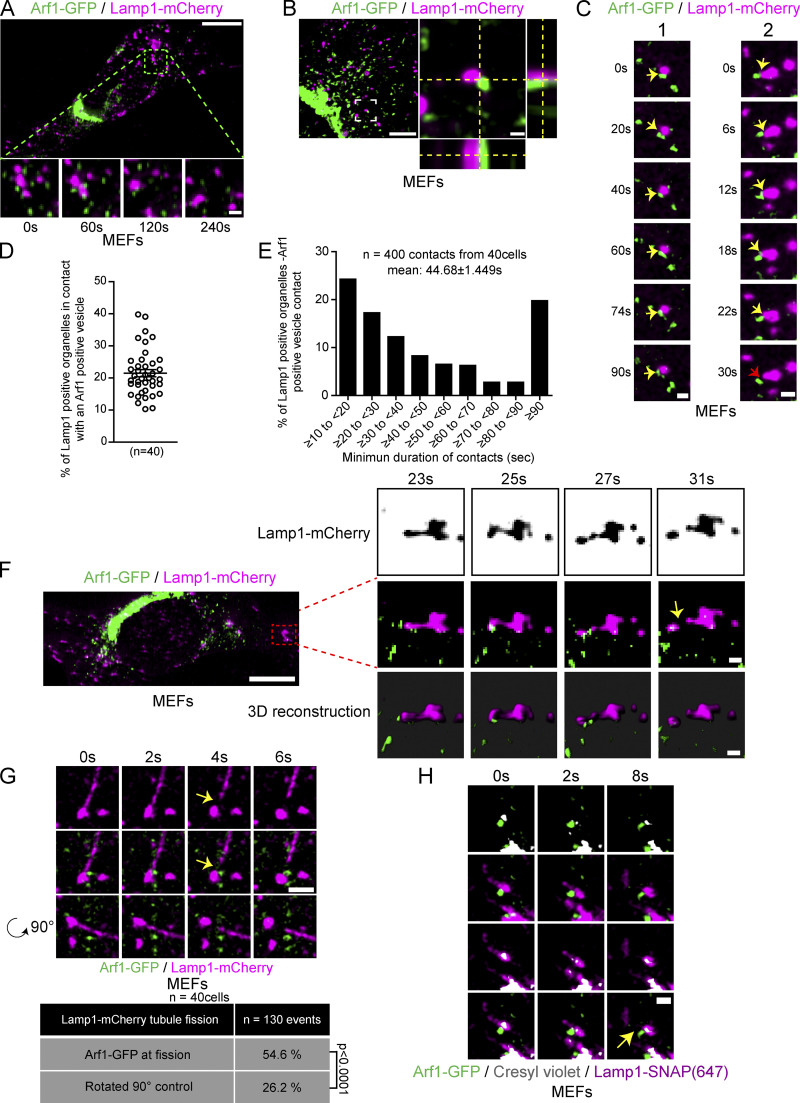
Arf1 positive vesicles make stable and dynamic contacts with Lamp1 positive organelles and mark lysosomal tubule fission sites. (A) LLSM imaging of a MEF expressing Lamp1-mCherry and Arf1-GFP. Insets show that Arf1 positive vesicles and Lamp1 positive organelles appear to make stable contact over time. Scale bars: 10 and 1 µm (inset). (B) Representative super-resolution image of a MEF cell expressing Arf1-GFP and Lamp1-mCherry. Inset shows a contact between an Arf1 positive vesicle and a Lamp1 positive organelle. Side panels show the view along the z-axis. Scale bar: 10 and 1 µm (inset). (C) Representative time-lapse images of two Lamp1 positive organelle-Arf1 positive vesicle contacts. Yellow arrows indicate contacts, and the red arrow indicates contact untethering. Scale bars: 1 µm. (D) Quantification of the percentage of Lamp1 positive organelles in contact with at least one Arf1 positive vesicle in MEFs. The mean ± SEM from three independent experiments is shown. (E) Quantification of the mean minimum duration of Lamp1 positive organelle-Arf1 positive vesicle contacts in seconds. 400 randomly chosen contacts from 40 MEFs were analyzed. (F) LLSM imaging of a MEF cell expressing Lamp1-mCherry and Arf1-GFP. Insets show time-lapse images of a single plane of only Lamp1-mCherry (inverted images) along with the corresponding merge and 3D reconstruction of a Lamp1 positive tubule fission event showing recruitment of an Arf1 positive vesicle at the fission site. Scale bars: 10 and 1 µm (insets). (G) Representative time-lapse imaging showing an Arf1-GFP positive vesicle marking the fission site of tubule from a Lamp1-mCherry positive organelle in a MEF cell starved for 8 h with HBSS (amino acid-free media). Yellow arrows indicate the fission event. The bottom panels are the same images, but the Lamp1-mCherry channel was rotated by 90°. Scale bar: 2 µm. The percentage of tubule fission events marked by Arf1-GFP vesicles was quantified along with the same data but where the Lamp1-mCherry channel was rotated by 90°. P value from a Fisher’s exact test, two-sided unpaired t test is shown. (H) Representative time-lapse imaging showing an Arf1-GFP vesicle marking the fission site of a tubule from a lysosome (Lamp1-SNAP/cresyl violet positive). Yellow arrow indicates fission. Scale bar: 1 µm.

