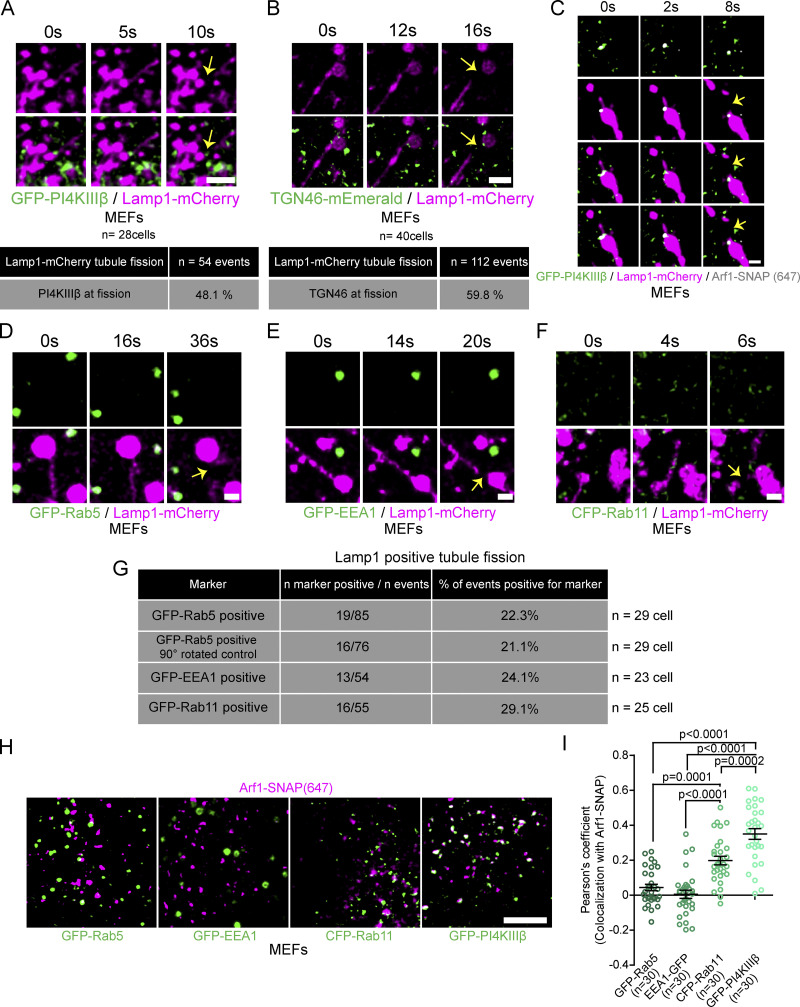
Figure 2.
Arf1 positive vesicles recruited to Lamp1 positive organelles tubule fission sites are positive for PI4KIIIβ and TGN46 but negative for endosome markers. (A and B) Time-lapse images and quantification of MEFs incubated for 8 h in HBSS media showing GFP-PI4KIIIβ (A) or TGN46-mEmerald (B) positive vesicles at the sites of Lamp1 positive tubule fission. Yellow arrows indicate fission. Scale bars: 2 µm. (C) Representative time-lapse images of a MEF as in A but showing a Lamp1-mCherry tubule fission event marked by a vesicle positive for both Arf1-SNAP and GFP-PI4KIIIβ. Yellow arrow indicates fission. Scale bar: 1 µm. (D–F) Time-lapse images of MEFs expressing Lamp1-mCherry and (D) GFP-Rab5, (E) GFP-EEA1, or (F) CFP-Rab11 incubated for 8 h in HBSS media. Yellow arrows indicate fission. Scale bars: 1 µm. (G) Quantification of vesicles positive for proteins in D–F shows them to be absent at Lamp1 positive tubule fission events. Also shown is the quantification of images in D where lamp1 was rotated by 90°. (H) Representative images of MEFs expressing Arf1-SNAP with GFP-Rab5, GFP-EEA1, CFP-Rab11, or GFP-PI4KIIIβ. Scale bar: 5 µm. (I) Pearson’s coefficient measurement of cells is described in H as indicated. The graph shows the mean ± SEM from three independent experiments. One-way ANOVA with Dunnett’s multiple comparison test. The number of events and cells quantified are shown with each quantification data.

