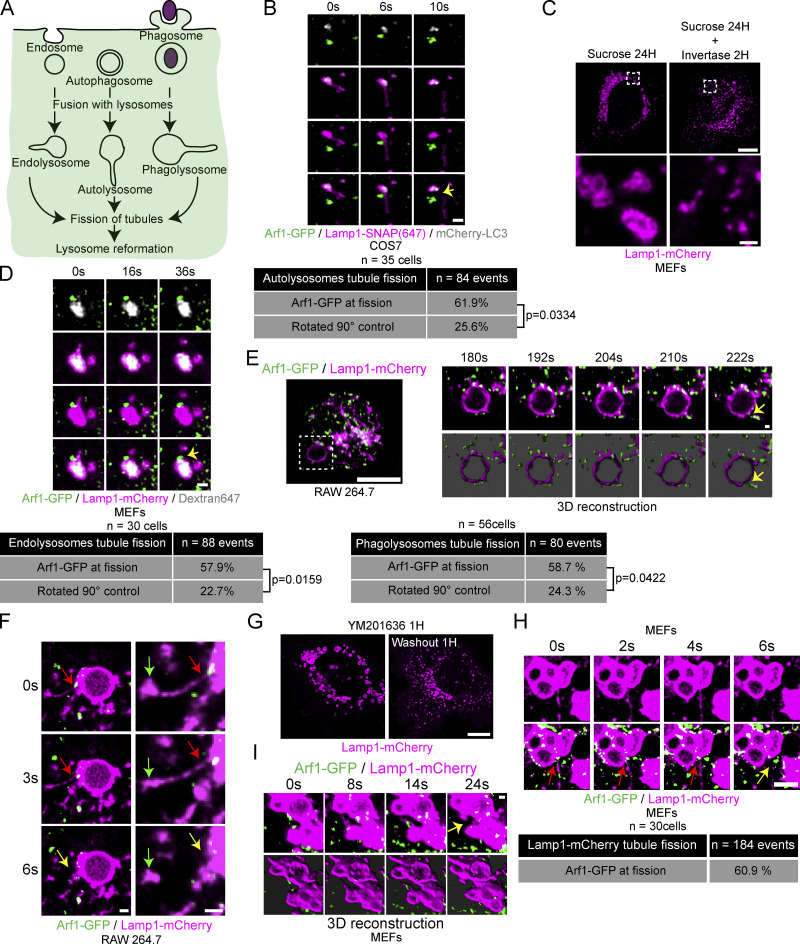
Figure 3.
Arf1 positive vesicles mark fission sites of tubules extending from autolysosomes, endolysosomes, phagolysosomes, and lysosomes. (A) Cartoon illustration of endocytosis, autophagy, phagocytosis, and lysosome reformation occurring in these processes. (B) Time-lapse images of a COS7 cell showing an autolysosomal (Lamp1+/LC3+) tubule fission event marked by an Arf1 positive vesicle and quantification of such events, n = 84 events from 35 COS7 cells. P value from a Fisher’s exact test, two-sided unpaired t test is shown. Yellow arrow indicates fission. Scale bar: 1 µm. (C) MEFs were incubated with 30 mM sucrose for 24 h to induce the formation of swollen endolysosomes (sucrosomes). The swelling was relieved using Invertase (0.5 mg/ml 2 h) to digest sucrose to restore lysosomes. Scale bars: 10 and 1 µm (insets). (D) Time-lapse images of MEFs showing an endolysosomal (Lamp1+/Dextran+) tubule fission event marked by an Arf1 positive vesicle and quantification of such events, n = 88 events from 30 MEFs. P value from a Fisher’s exact test, two-sided unpaired t test is shown. Lamp1-mCherry signal rotated by 90° was used as a negative control. Yellow arrow indicates fission. Scale bar: 1 µm. (E and F) RAW264.7 macrophages were fed opsonized SRBCs, and phagocytosis was synchronized via centrifugation. Live-cell timelapse images showing Arf1-GFP vesicles at phagolysosomal tubule fission sites using LLSM and its 3D reconstruction (bottom panels; E) and live confocal microscopy (F). Red and yellow arrows indicate tubule neck and tubule fission, respectively. The green arrows indicate the tip of the tubule. Scale bars: 10 µm for E; 1 µm for inset in E and F. Quantification of such events, n = 80 events from 56 RAW 264.7 cells. P value from a Fisher’s exact test, two-sided unpaired t test is shown. Lamp1-mCherry signal rotated by 90° was used as a negative control. (G) MEFs were treated with reversible PIKfyve inhibitor YM201636 (1 µM for 1 h) to promote swelling of lysosomes. Washout of the inhibitor allows a return to normal lysosomal size via lysosome reformation in about an hour. Scale bar: 10 µm. (H and I) Time-lapse confocal images of a Lamp1 positive tubule fission event post-YM201636 washout showing recruitment of an Arf1 positive vesicle with quantification of such events (H) n = 184 events from 30 MEFs and LLSM images with three-dimensional reconstruction (I). Images were acquired 5–40 min after inhibitor washout. Red and yellow arrows indicate tubule neck and tubule fission, respectively. Scale bars: 2 µm (H) and 1 µm (I).

