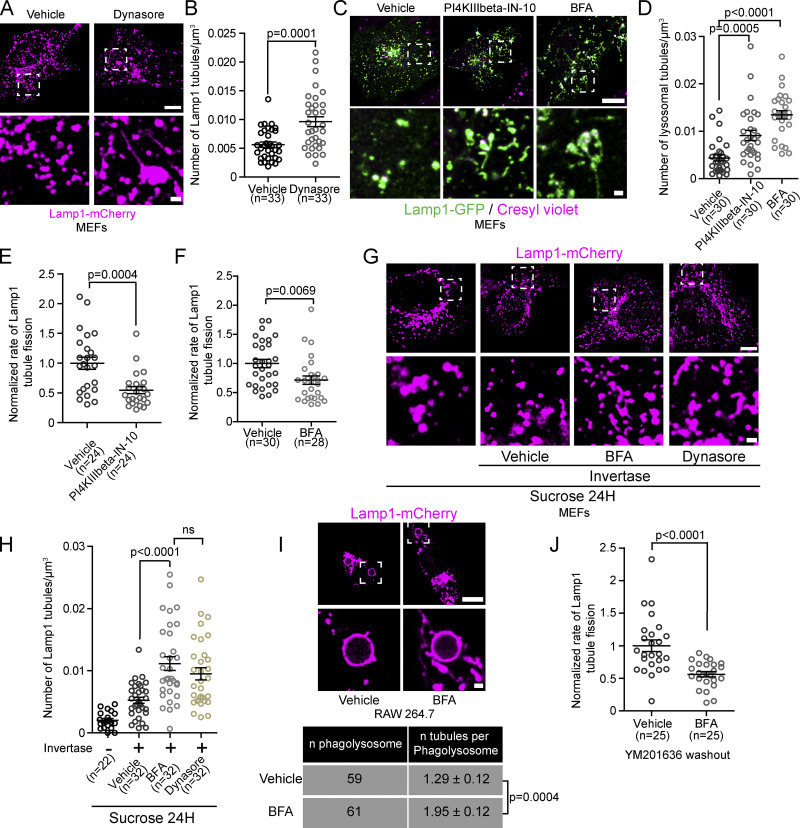
Figure 4.
Inhibition of Arf1 activation or PI4KIIIβ function impairs the fission of lysosomal tubules. (A and B) MEFs expressing Lamp1-mCherry and treated with Dynasore (40 µM) for 2 h show increased Lamp1 positive tubule numbers (A). Scale bars: 10 and 1 µm (inset). Quantification of the number of lysosomal tubules (B). Two-sided unpaired t test. (C) MEFs treated with the PI4KIIIβ inhibitor PI4KIIIbeta-IN-10 (25 nM for 3 h) or Arf1 activation inhibitor Brefeldin A (BFA; 10 µg/ml) and stained with the acidic marker cresyl violet. Scale bars: 10 and 1 µm (inset). (D) Quantification of the number of lysosomal tubules in cells described in C. One-way ANOVA with Dunnett’s multiple comparison test. (E and F) Normalized rate of Lamp1 positive tubule fission in MEFs starved for 8 h in HBSS and treated with PI4KIIIbeta-IN-10 (3 h; E) or with BFA (1 h) before imaging (F). Two-sided, unpaired t test. (G) Representative images of endolysosomes (sucrosomes) tubule formation assay in MEFs. After 1 h invertase treatment, cells were treated with BFA or Dynasore for 1 h and imaged. An equal volume of ethanol was used as vehicle control. Scale bar: 10 µm. (H) Quantification of the number of Lamp1 positive tubules of conditions in G. One-way ANOVA with Dunnett’s multiple comparison test. (I) Representative images of phagolysosomes in RAW 264.7 cells phagocyting SRBCs (scale bar: 10 µm) and quantification of the number of tubules per phagosome in cells treated with BFA (30 min) or vehicle control (Ethanol, 30 min). Two-sided unpaired t test. (J) Normalized rate of Lamp1 positive tubule fission in MEFs after inhibition of PIKfyve (YM201636 1 µM, 1 h) and washout of the drug in the presence of BFA or vehicle control. Two-sided unpaired t test. (B, D–H, and J). n = number of cells per condition. All graphs show the mean ± SEM from three independent experiments.

