Figure 5.
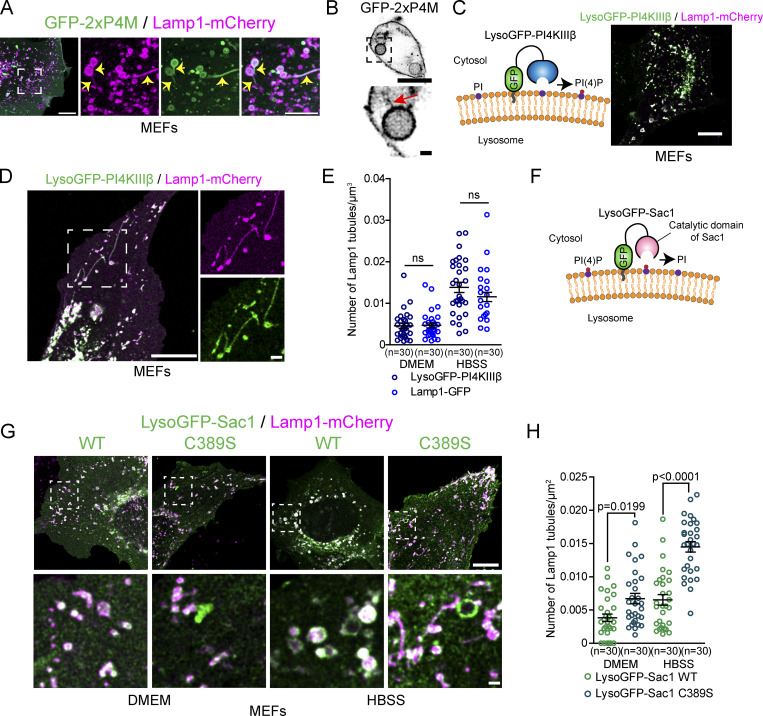
PI(4)P has a pro-tubulation role at lysosomes. (A) Representative images of Lamp1 positive tubules in MEFs expressing Lamp1-mCherry and the PI(4)P biosensor GFP-2xP4M after 8 h of starvation (HBSS). Lamp1 tubules are positive for 2xP4M. Scale bars: 10 and 5 µm (inset). (B) Representative images of a phagolysosome showing tubules positive for the PI(4)P biosensor GFP-2xP4M in RAW 264.7 macrophages phagocytosing SRBCs. Scale bars: 10 and 1 µm (inset). (C) LysoGFP-PI4KIIIβ fusion protein comprises PI(4)P producing enzyme PI4KIIIβ fused to the lysosomal targeting sequence of p18. LysoGFP-PI4KIIIβ colocalizes with Lamp1-mCherry in MEFs. Scale bars: 10 µm. (D) MEFs in HBSS show LysoGFP-PI4KIIIβ colocalized with Lamp1-mCherry positive tubules. Scale bar: 10 and 1 µm (inset). (E) Quantification of the number of Lamp1-mCherry positive tubules in MEFs expressing Lamp1-GFP or LysoGFP-PI4KIIIβ at basal state (DMEM) or 8H HBSS. The graphs show the mean ± SEM cells from three independent experiments. Two-way ANOVA with Tukey’s multiple comparison test. ns: P = 0.9997 (DMEM) and P = 0.3093 (HBSS). (F) The PI(4)P phosphatase Sac1 was targeted to lysosomes by fusing it with the lysosomal targeting sequence of p18 to deplete lysosomes of PI(4)P. (G) Representative images of MEFs expressing LysoGFP-Sac1 wild-type (WT) or the catalytic dead (C389S) and Lamp1-mCherry at basal state (DMEM) or after prolonged starvation (HBSS, 8H). Scale bar: 10 and 1 µm (inset). (H) Quantification of the number of Lamp1 positive tubules in cells shown in G. The graphs show the mean ± SEM cells from three independent experiments. Two-way ANOVA with Tukey’s multiple comparison test.

