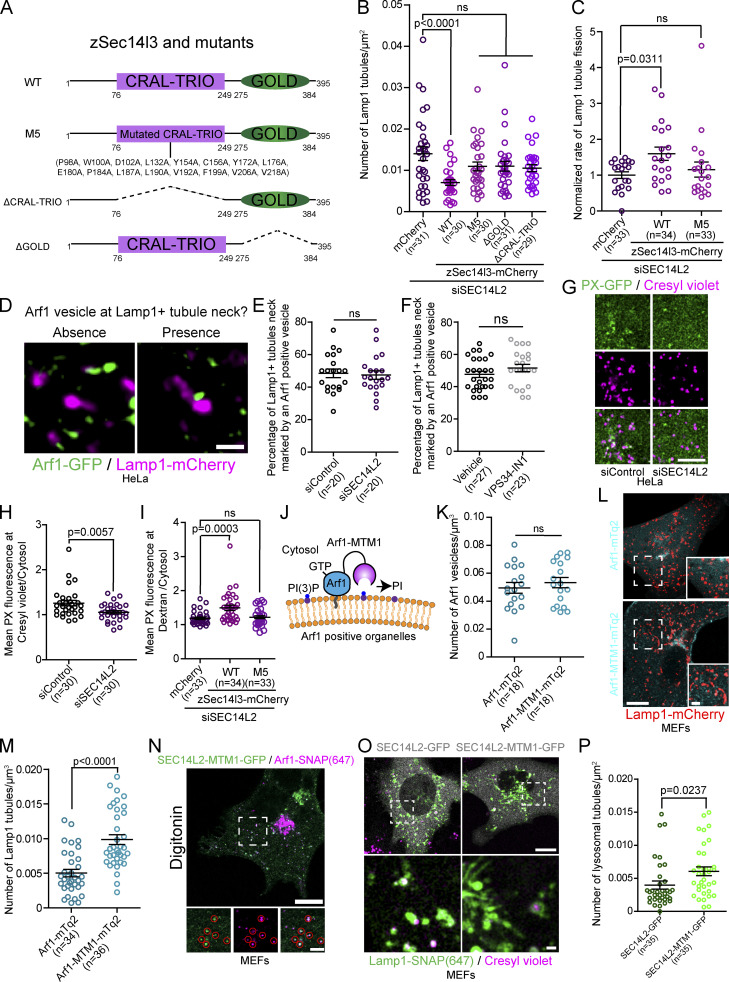
Figure 8.
The PI(3)P binding domain of SEC14L2 is required for regulating lysosomal PI(3)P and tubule fission. (A) zSec14l3 constructs used in the study. (B) Quantification of the number of Lamp1 positive tubules in cells treated with the indicated siRNA and expressing the indicated constructs. One-way ANOVA with Dunnett’s multiple comparison test. P value = 0.1776 (M5), 0.1808 (ΔCRAL-TRIO), and 0.1069 (ΔGOLD). (C) Normalized rate of Lamp1 tubule fission in cells treated with the indicated siRNAs and expressing the indicated constructs. One-way ANOVA with Dunnett’s multiple comparison test. ns = 0.7442. (D–F) Representative images showing the absence and presence of an Arf1 positive vesicle at Lamp1 positive organelle tubule necks. Scale bar: 1 µm (D). Quantification of the percentage of Lamp1 tubule necks marked by an Arf1 positive vesicle in cells treated with the indicated siRNA and starved (HBSS) for 8 h (E) or treated with VPS34-IN1 (1 µM for 1 h; F). Two-sided unpaired t test. ns: P value = 0.7773 (E) and 0.1825 (F). (G) Representative images of a 10 µm × 10 µm section of a cell treated with the indicated siRNA expressing PX-GFP. Acidic lysosomes were marked using cresyl violet Scale bar: 5 µm. (H) Quantification of the PX levels colocalizing with cresyl violet normalized to the cytosolic level of PX of cells in G. Two-sided unpaired t test. (I) Quantification of the PX levels colocalizing with overnight chased 10 kD Dextran normalized to the cytosolic level in cells treated with indicated siRNA and expressing the indicated constructs. One-way ANOVA with Dunnett’s multiple comparison test. ns = 0.8898. (J) Cartoon illustration of the Arf1-MTM1 construct. (K) Quantification of the number of Arf1-GFP positive vesicles per cell in MEFs expressing Arf1-mTq2 or Arf1-MTM1-mTq2. Two-sided unpaired t test. ns: P value = 0.4901. (L and M) (L) Representative images of cells expressing Lamp1-mCherry and Arf1-mTq2 or Arf1-MTM1-mTq2; scale bar: 10 µm. (M) Quantification of the number of Lamp1 positive tubules in these cells. Two-sided unpaired t test. (N) Representative Airyscan image of a MEF cell expressing SEC14L2-MTM1-GFP and Arf1-SNAP. Red circles show SEC14L2-MTM1 colocalizing with Arf1 positive vesicles. Scale bar: 10 and 1 µm (inset). (O and P) Representative Airyscan images of MEFs expressing Lamp1-SNAP and SEC14L2-GFP or SEC14L2-MTM1-GFP and treated with Cresyl violet to mark acidic lysosomes (scale bar: 10 and 1 µm [inset]; O) and the quantification of the number of lysosomal tubules (P). Two-sided unpaired t test. All graphs (B, C, E, F, H, I, K, M, and P) show the mean ± SEM, cells from three independent experiments.

