Figure S3.
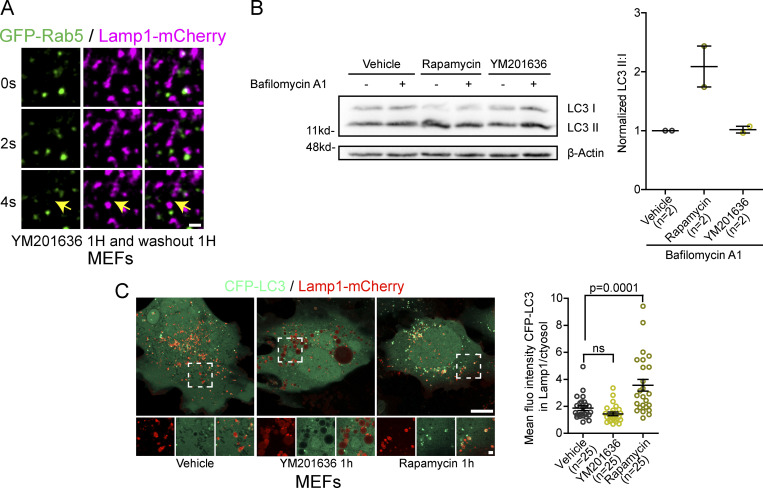
Short-term inhibition of PIKfyve with YM201636 does not induce autophagy or formation of endolysosomes. (A) Time-lapse imaging of a Lamp1 positive tubule fission event in a MEF cell expressing Rab5-GFP and Lamp1-mCherry after short-term inhibition of PIKfyve using YM2013636 (1 µM for 1 h) followed by 1 h washout of the drug. The yellow arrows indicate tubule fission. Scale bar = 1 µm. (B) Representative Western blot images of MEFs treated 1 h with YM201636 (1 µM) or vehicle control, rapamycin (10 µg/ml) was used as a positive control. Bafilomycin A1 treatment (500 nM, 1 h) was used to inhibit degradation of autophagosomes allowing to evaluate whether YM201636 treatment induced formation of autophagosomes. Levels of LC3 II were normalized to LC3 I to quantify autophagosomes. β-Actin was used as a loading control. The graphs show the mean ± SEM, cells from two independent experiments. (C) Representative images of MEFs cells expression CFP-LC3 and Lamp1-mCherry and treated with YM201636 (1 µM for 1 h) or Rapamycin (10 µg/ml) as a positive control. Scale bars: 10 and 2 µm (inset). Quantification of the mean fluorescence intensity of CFP-LC3 colocalizing with Lamp1 normalized to that of the cytosol. The graphs show the mean ± SEM, cells from three independent experiments. One-way ANOVA with Dunnett’s multiple comparison test. ns = 0.4570. Source data are available for this figure: SourceData FS3.

