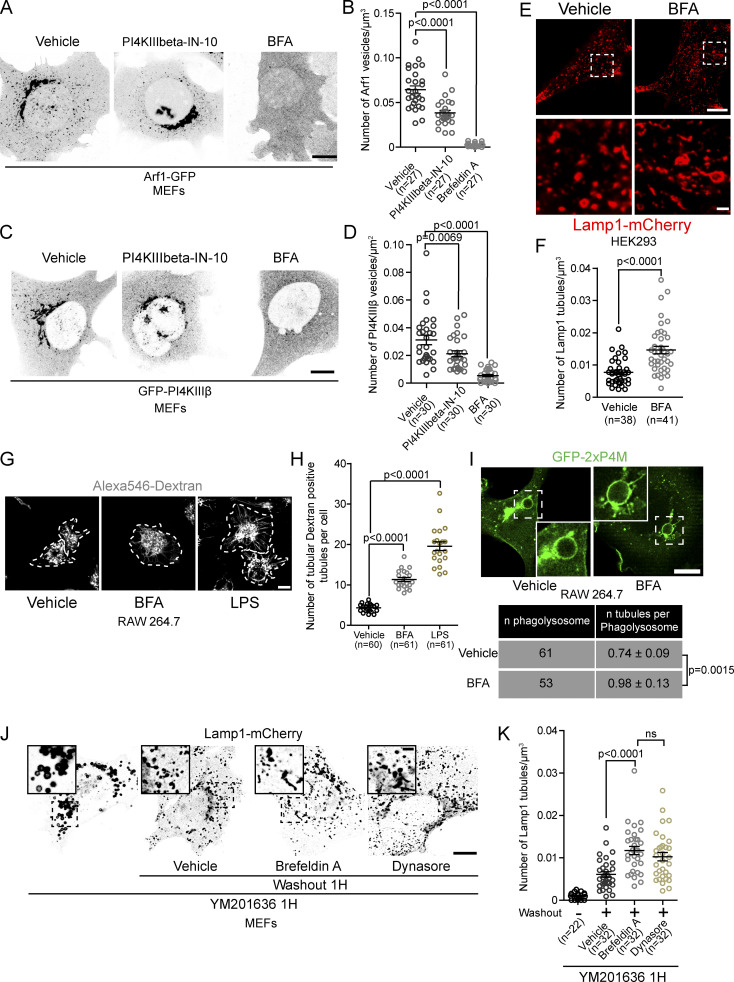
Figure S4.
Inhibition of formation and/or function of Arf1-PI4KIIIβ positive vesicles increases the number of lysosomal tubules. (A) Representative images of MEFs expressing Arf1-GFP and treated with PI4KIIIbeta-IN-10 (25 nM, 3 h) or BFA (10 µg/ml, 1 h). Ethanol was used as a vehicle control. Scale bar: 10 µm. (B) Quantification of the number of Arf1-GFP positive vesicles per cell. One-way ANOVA with Dunnett’s multiple comparison test. (C) Representative images of MEFs expressing GFP-PI4KIIIβ and treated with PI4KIIIbeta-IN-10 (25 nM, 3 h) or BFA (10 µg/ml, 1 h). Ethanol was used as a vehicle control. Scale bar: 10 µm. (D) Quantification of the number of GFP-PI4KIIIβ positive vesicles per cell. One-way ANOVA with Dunnett’s multiple comparison test. (E) Representative images of HEK293 cells expressing Lamp1-mCherry and treated with BFA (10 µg/ml, 1 h) or ethanol as a vehicle control. Scale bars: 10 and 1 µm (inset; F) Quantification of the number of Lamp1 positive tubules in these cells. Two-sided unpaired t test. (G) Representative images of primary mouse macrophages that were pulsed with Alexa546-Dextran (50 µg/ml, 30 min) to mark lysosomes and treated with BFA (5 µg/ml, 2 h). LPS (500 ng/ml, 2 h) was used as a positive control. DMSO was used as a negative control (vehicle). Images were acquired using a Spinning disk confocal microscope system (Quorum Technologies). White dotted lines show cell outline. Scale bar: 10 µm. (H) Quantification of the number of Dextran positive tubules in these cells. One-way ANOVA with Dunnett’s multiple comparison test. (I) Representative images of phagolysosomes from RAW264.7 macrophages expressing GFP-2xP4M and treated with BFA (10 µg/ml) 15 min after induction of phagocytosis of SRBCs. Cells were imaged from 15 to 30 min after BFA was added. Ethanol was used as vehicle. Scale bar: 10 µm. Quantification of the number of tubules from these cells. Two-sided unpaired t test. (J) Representative images of MEFs expressing Lamp1-mCherry. Cells were treated with YM201636 (1 µM, 1 h) to inhibit PIKfyve and were then washed out to remove PIKfyve inhibitor in presence of BFA (10 µg/ml) or Dynasore (40 µM) and imaged 1 h after. Scale bars: 10 and 2 µm (inset). (K) Quantification of the number of Lamp1 positive tubules from these cells. One-way ANOVA with Dunnett’s multiple comparison test. All graphs (B, D, F, H and K) show the mean ± SEM, cells from three independent experiments.

