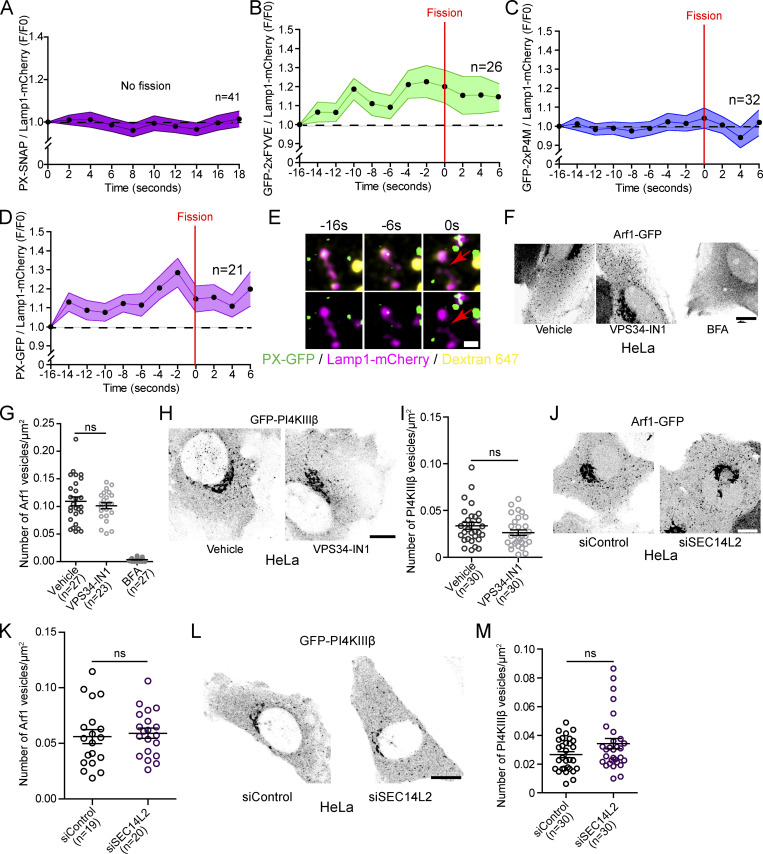
Figure S7.
PI(3)P and PI(4)P levels during Lamp1 positive tubule fission events and SEC14L2 depletion or VPS34-IN1 do not affect Arf1-PI4KIIIβ positive vesicles formation. (A) Normalized fluorescence intensity of PX (PI(3)P biosensor) at Lamp1 positive organelles with tubules that are not undergoing any fission events. MEFs were starved (HBSS) for 8 h to promote formation of tubules from Lamp1 positive organelles. (B) Normalized fluorescence intensity of 2xFYVE (PI(3)P biosensor) at Lamp1 positive organelles during tubule fission events. MEFs were starved (HBSS) for 8 h. (C) Normalized fluorescence intensity of 2xP4M (PI(4)P biosensor) at Lamp1 positive organelles during tubule fission events. MEFs cells were starved (HBSS) for 8 h. (D) Normalized fluorescence intensity of PX (PI(3)P biosensor) at lysosomes (Lamp1 and overnight chased fluorescent 10 kD Dextran). MEFs were starved (HBSS) for 8 h. Red arrows indicate fission. Scale bar: 1 µm. (E) Representative time-lapse image of a Lamp1 fission event from a Lamp1 and overnight chase Dextran 647 positive organelle analyzed in MEFs expressing the PI(3)P biosensor PX-GFP. Red arrows indicate fission. Scale bar: 1 µm. (F) Representative images of HeLa cells expressing Arf1-GFP and treated with VPS34-IN1 (1 µM) or BFA (10 µg/10 ml) for 1 h. Scale bar: 10 µm. (G) Quantification of the number of Arf1-GFP positive vesicles per cell. One-way ANOVA with Dunnett’s multiple comparison test. ns = 0.5088. (H) Representative images of HeLa cells expressing GFP-PI4KIIIβ and treated with the indicated drug for 1 h. Ethanol was used as a vehicle control. Scale bar: 10 µm. (I) Quantification of the number of GFP-PI4KIIIβ positive vesicles in these cells. Two-sided unpaired t test. ns = 0.1194. (J) Representative Airyscan images of HeLa cells expressing Arf1-GFP and treated with indicated siRNAs. Scale bar: 10 µm. (K) Quantification of the number of Arf1-GFP positive vesicles per cell. Two-sided unpaired t test. ns = 0.6999. (L) Representative images of HeLa cells expressing GFP-PI4KIIIβ and treated with the indicated siRNAs. (M) Quantification of the number of GFP-PI4KIIIβ positive vesicles in these cells. Two-sided unpaired t test. ns = 0.0676. (A–D, G, I, K, and M). All graphs show the mean ± SEM, cells from two independent experiments.

