Figure 1.
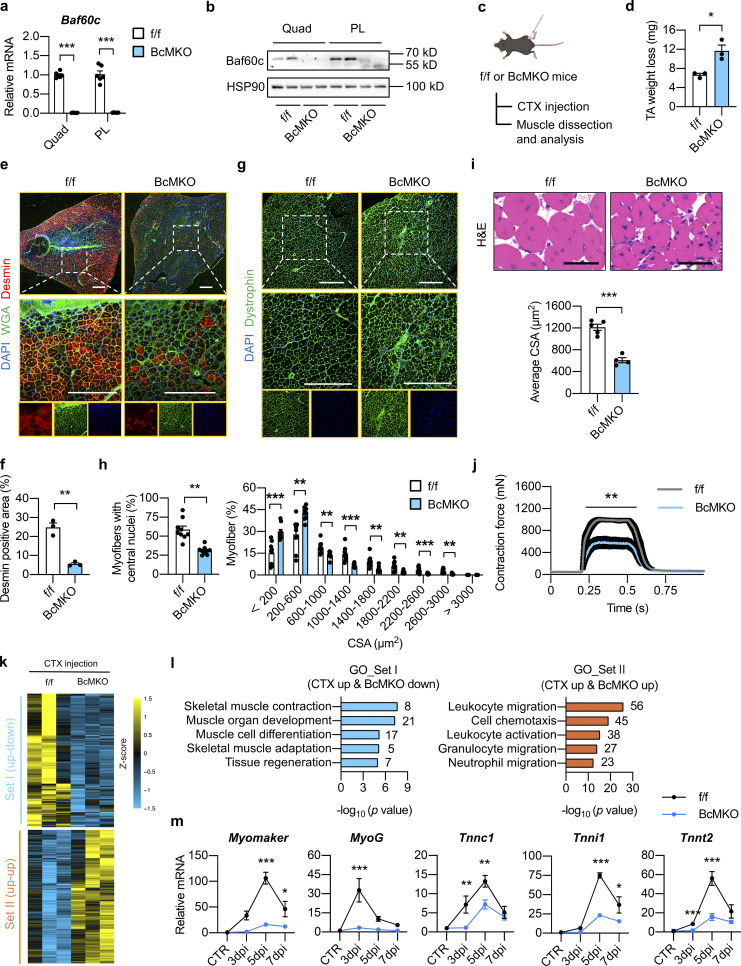
Myofiber-specific inactivation of Baf60c impairs muscle regeneration. (a) qPCR analysis of Baf60c gene expression in quadriceps (Quad) or plantaris (PL) muscles from Baf60cflox/flox (f/f) and Baf60cflox/flox MLC-Cre (BcMKO) mice (n = 6 mice per group). ***P < 0.001; two-tailed unpaired Student’s t test. (b) Representative immunoblots of total Quad or PL muscle protein lysates from f/f and BcMKO mice. (c) Schematic outline of cardiotoxin (CTX)-induced muscle injury and regeneration model in f/f and BcMKO mice. CTX was i.m. injected into the TA muscle on one leg, and PBS was injected into the TA muscle on the contralateral leg as control. (d) TA weight loss (calculated by subtraction of tissue weight in CTX-injected TA muscle on one leg from PBS-injected TA muscle on the contralateral leg in the same mouse) in f/f and BcMKO mice at 7 dpi (n = 3 mice per group). *P < 0.05; two-tailed unpaired Student’s t test. (e) Representative immunofluorescence images of Desmin (red), WGA (green), and DAPI (blue) of TA muscle cross-sections from f/f and BcMKO mice at 7 dpi. WGA, wheat germ agglutinin. Scale bar: 400 μm. (f) Quantification of the percentage of Desmin positive area in TA muscle cross-sections from f/f and BcMKO mice described in e (n = 3 mice per group). **P < 0.01; two-tailed unpaired Student’s t test. (g) Representative immunofluorescence images of Dystrophin (green) and DAPI (blue) of TA muscle cross-sections from f/f and BcMKO mice at 14 dpi. Scale bar: 400 μm. (h) The percentages of myofibers with central nuclei (left) and the percentage distribution of myofiber CSA (right) as described in g (n = 9 mice per group). **P < 0.01, ***P < 0.001, two-tailed unpaired Student’s t test. (i) Representative H&E staining (upper) and average CSA (lower) of TA muscles from f/f and BcMKO mice at 14 dpi (n = 4–5 mice per group; atleast four sections/mouse). Scale bar: 100 μm. ***P < 0.001; two-tailed unpaired Student’s t test. (j) Measurement of tetanic contraction force in TA muscles from f/f and BcMKO mice at 14 dpi (n = 5–7 mice per group). **P < 0.01; area under curve (AUC) for each mouse from f/f and BcMKO group was analyzed with two-tailed unpaired Student’s t test. (k) Heatmap representation of the scaled, normalized FPKM (as Z-score) of significantly changed 992 genes as described in Fig. S2 f (n = 3 mice per group). (l) GO analysis of genes in Set I (CTX up-down) and Set Ⅱ (CTX up-up) described in k. Most significant and nonredundant biological processes with respective gene numbers and −log10 (P value) are shown. (m) qPCR analysis of the dynamic expression patterns of indicated myogenic-related genes in TA muscle from f/f and BcMKO mice at different days post-injury (n = 3–4 mice at each time point from each group). *P < 0.05, **P < 0.01, ***P < 0.001, two-way ANOVA with multiple comparisons. All experimental data were verified in at least two independent experiments. Source data are available for this figure: SourceData F1.

