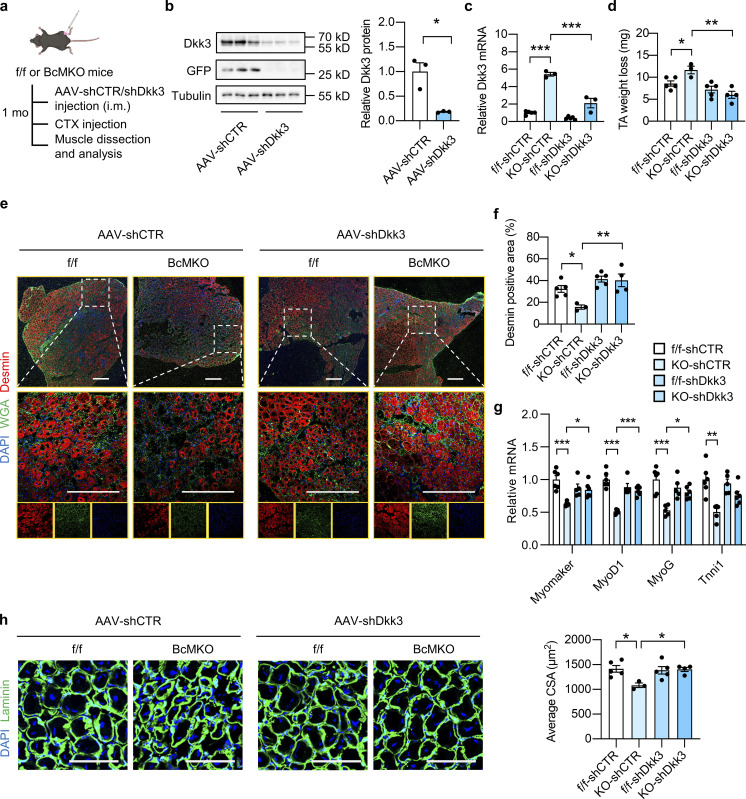
Figure 4.
Dkk3 knockdown rescues the regeneration defect in muscles from BcMKO mice. (a) Schematic representation of mouse model using AAV system to achieve local muscle Dkk3 knockdown in f/f and BcMKO mice and the following experimental setup. (b) Immunoblots (left) and quantification of relative Dkk3 protein levels (right) of total protein lysates from AAV-shCTR or AAV-shDkk3 injected TA muscles in BcMKO mice (n = 3 mice per group). AAV-shCTR, AAV-control shRNA; AAV-shDkk3, AAV-Dkk3 shRNA. *P < 0.05; two-tailed unpaired Student’s t test. (c) qPCR analysis of Dkk3 gene expression in the AAV-shCTR or AAV-shDkk3 injected TA muscles of f/f and BcMKO mice (n = 3–5 mice per group). ***P < 0.001; one-way ANOVA with multiple comparisons. (d) TA weight loss in indicated groups at 7 dpi (n = 3–5 mice per group). *P < 0.05, **P < 0.01; one-way ANOVA with multiple comparisons. (e) Representative immunofluorescence images on Desmin (red), WGA (green), and DAPI (blue) of TA muscle cross-sections from AAV-shCTR or AAV-shDkk3 injected f/f and BcMKO mice at 7 dpi. Scale bar: 400 μm. (f) Quantification of the percentage of Desmin positive area percentage of TA muscle cross-sections from AAV-shCTR or AAV-shDkk3 injected f/f and BcMKO mice as described in e (n = 3–5 mice per group). *P < 0.05, **P < 0.01; one-way ANOVA with multiple comparisons. (g) qPCR analysis of muscle differentiation-related genes in indicated groups at 3 dpi (n = 5–6 mice per group). *P < 0.05, **P < 0.01, ***P < 0.001; one-way ANOVA with multiple comparisons. (h) Representative immunofluorescence images (left) of laminin (green) and DAPI (blue) and average CSA (right) of TA muscle cross-sections from indicated groups (n = 3–5 mice per group; at least three sections/mouse). Scale bar: 100 μm. One-way ANOVA with multiple comparisons. All values represent mean ± SEM. All experimental data were verified in at least two independent experiments. Source data are available for this figure: SourceData F4.

