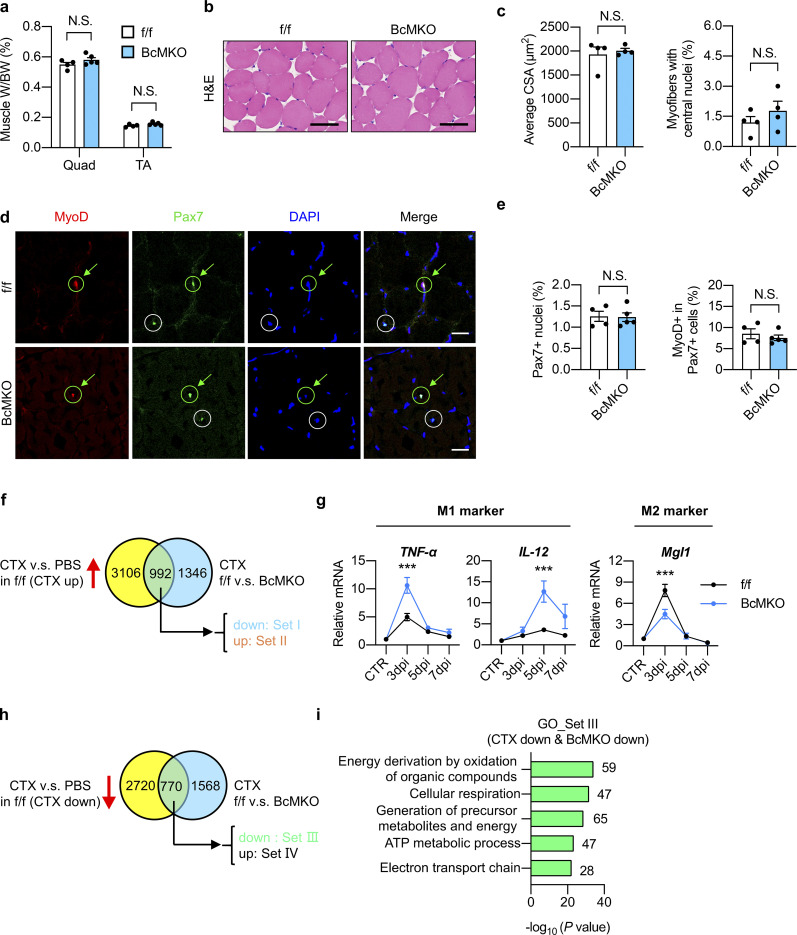
Figure S2.
Characterization of non-regenerating and regenerating skeletal muscles from control and BcMKO mice. (a–e) Muscle weight/body weight (BW) ratio (a), representative H&E staining (b), average cross-sectional area (CSA; c, left), and the percentage of myofibers with central nuclei (c, right), representative immunofluorescence images of MyoD (red), Pax7 (green), and DAPI (blue; d), percentage of Pax7+ nuclei to total DAPI+ nuclei (e, left), and percentage of MyoD+ cells in Pax7+ satellite cells (e, right) of TA muscle cross-sections from f/f and BcMKO mice under normal non-injury conditions without CTX injection (n = 4–5 mice per group; at least four sections/mouse). Scale bars represent 100 μm in b and 20 μm in d. Data represent mean ± SEM; N.S., not significant; two-tailed unpaired Student’s t test. (f) Flowchart of RNA-Seq data analysis of TA muscles with PBS or CTX injection at 3 dpi from f/f and BcMKO mice. CTX-induced genes in f/f mice (genes with log2FC (f/f_CTX/f/f_PBS) > −1 and P < 0.05) were divided into two groups: Set I (CTX up & BcMKO down, genes with log2FC (BcMKO_CTX/f/f_CTX) < −0.3 and P < 0.05) and Set II (CTX up & BcMKO up, genes with log2FC (BcMKO_CTX/f/f_CTX) > 0.3 and P < 0.05). Venn plot shows the overlapping genes between the two indicated datasets. (g) qPCR analysis of indicated inflammation-related genes in TA muscles from f/f and BcMKO mice at different days post-injury (n = 3–4 mice at each time point from each group). Data represent mean ± SEM; ***P < 0.001; two-way ANOVA with multiple comparisons. (h) Flowchart of RNA-Seq analysis of TA muscles with or without CTX injection at 3 dpi from f/f and BcMKO mice. CTX-suppressed genes in f/f mice (genes with log2FC (f/f_CTX/f/f_PBS) < −1 and P < 0.05) were divided into two groups: Set III (CTX down & BcMKO down, genes with log2FC (BcMKO_CTX/f/f_CTX) < −0.3 and P < 0.05), and Set Ⅳ (CTX down & BcMKO up, genes with log2FC (BcMKO _CTX/f/f_CTX) > −0.3 and P < 0.05). Venn plot shows the overlapping genes between the two given datasets. (i) GO analysis of genes in Set III as described in h. Most significant and nonredundant biological processes with respective gene numbers and −log10 (P value) are shown. All experimental data were verified in at least two independent experiments.

