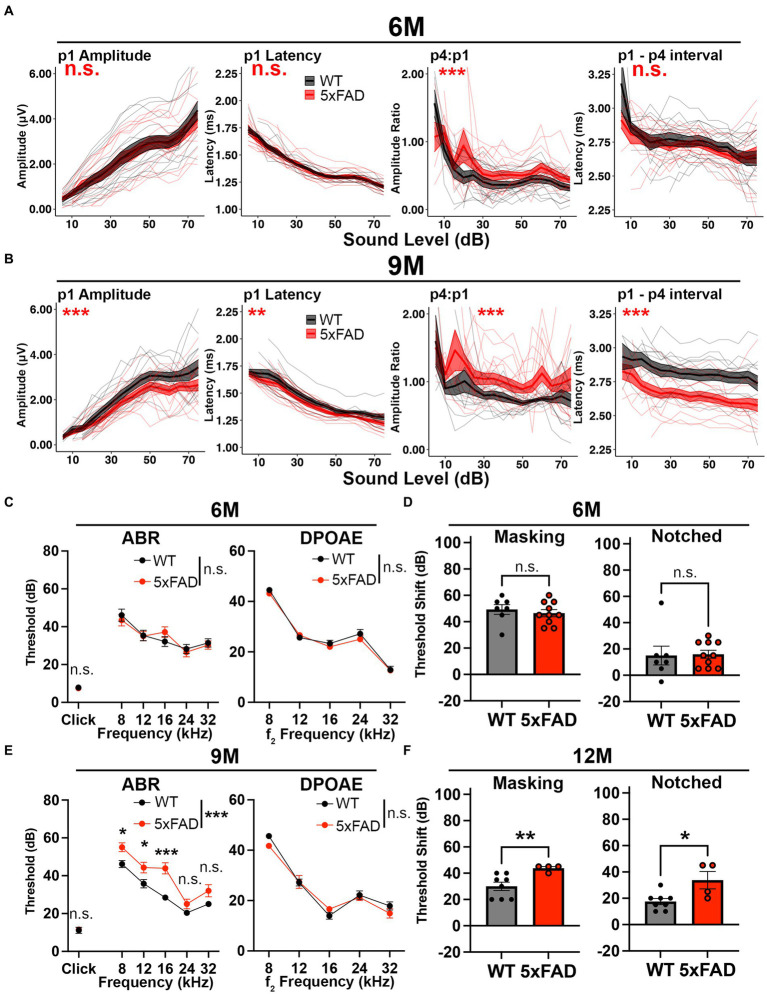
Figure 3.
Central gain increases prior to central auditory processing disorder in 5xFAD mice. 5xFAD mice (red) and their WT littermates (black). (A,B) The wave I amplitude, latency, wave IV to I amplitude ratio, wave I to IV interpeak latency (from left to right) of click-evoked ABRs from 5xFAD (n = 16) and their WT littermates (n = 14) at (A) 6 M and (B) 9 M. (C,E) ABR (left) and DPOAE (right) thresholds of 5xFAD mice and their WT littermates at (C) 6 M and (E) 9 M. (D,F) ABR threshold shifts with masking (left) and notched noise (right) for 5xFAD mice and their WT littermates at (D) 6 M (5xFAD, n = 10; WT, n = 7) and (F) 12 M (5xFAD, n = 4; WT, n = 8). (C–F) Data are expressed as the mean ± SEM. Asterisks denote the significant differences between genotypes: no significance (n.s.), p ≥ 0.05; *p < 0.05; **p < 0.01; and ***p < 0.001.

