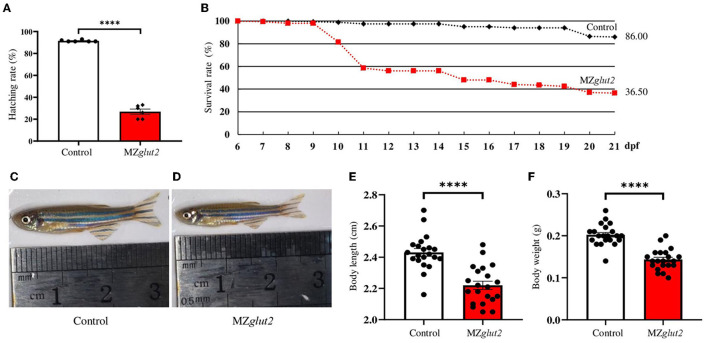
Figure 2.
glut2-deletion results in growth retardation in MZglut2 fish. (A) The hatching rate analysis of the control and MZglut2 fish from 0 to 3 dpf (n = 6). (B) Survival rate analysis of the control and MZglut2 fish from 6–21 dpf (200 fish of each genotype were used for analysis). (C, D) Representative images of the overall morphology of the control and MZglut2 fish at 3 mpf. (E, F) Body weight and body length of the control and MZglut2 fish at 3 mpf (n = 21). A two-tailed unpaired t-test was used to detect significance. ****P < 0.0001.

