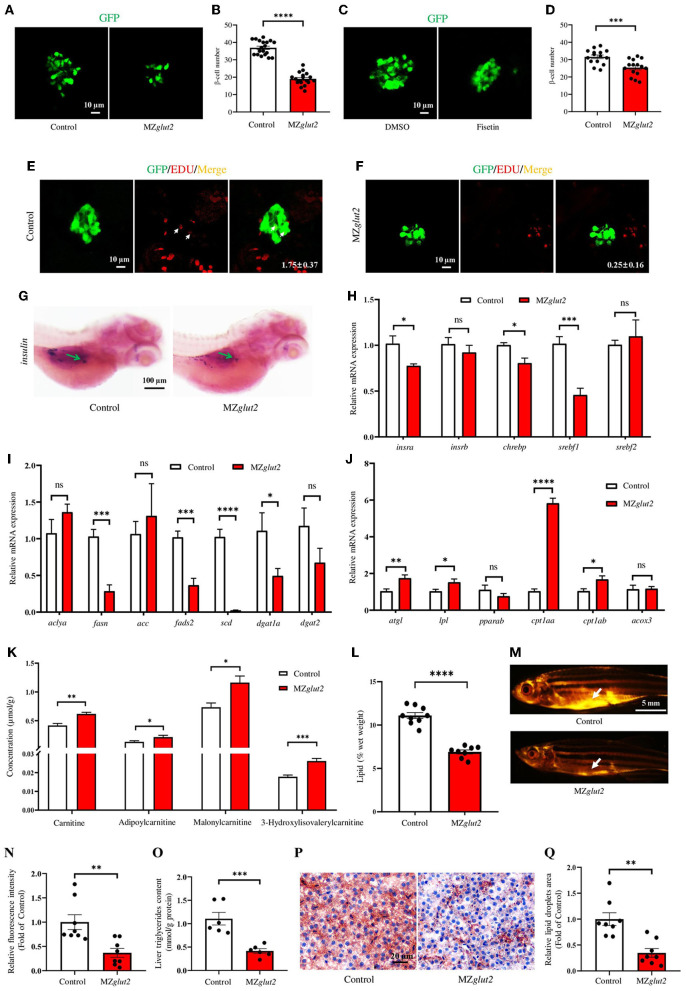
Figure 4.
glut2-deletion results in impaired insulin-mediated anabolic metabolism in MZglut2 fish. (A) Representative images of β-cells in the control and MZglut2 larvae at 5 dpf. (B) The statistical analysis of β-cells in the control (n = 19) and MZglut2 (n = 18) larvae at 5 dpf. (C) Representative images of β-cells in DMSO- and Fisetin-treated larvae at 5 dpf. (D) The statistical analysis of β-cells in DMSO- and Fisetin-treated larvae at 5 dpf (n = 16). (E) Representative images of EdU stained β-cells in the control fish at 5 dpf. Red signal-positive β-cells are indicated by arrows (n = 8). (F) Representative images of EdU staining β-cells in MZglut2 larvae at 5 dpf (n = 8). (G) WISH using the insulin probe to the control and MZglut2 larvae at 5 dpf, with the green arrow representing the signal area. (H) The transcriptional expression levels of insra, insrb, chrebp, srebf1, and srebf2 in the liver of the control and MZglut2 fish at 3 mpf (n = 6). (I) The transcriptional expression levels of aclya, fasn, acc, fads2, scd, dgat1a, and dgat2 in the liver of the control and MZglut2 fish at 3 mpf (n = 6). (J) The transcriptional expression levels of atgl, lpl, pparab, cpt1aa, cpt1ab, and acox3 in the liver of the control and MZglut2 fish at 3 mpf (n = 6). (K) The quantification of carnitine metabolites based on the observations of metabolomics in the liver of control and MZglut2 fish at 3 mpf (n = 6). (L) The measurement of the lipid content of the control (n = 9) and MZglut2 (n = 8) fish at 3 mpf. (M) Nile Red staining of the control and MZglut2 fish at 3 mpf. White arrows: visceral adipose tissue. (N) The bar chart represents the relative fluorescence intensity of the control and MZglut2 fish after Nile Red staining (n = 8). (O) Liver triglyceride content at 3 mpf (n = 6). (P) Oil Red O staining of liver sections for distribution of lipid droplets in the control and MZglut2 fish at 3 mpf. (Q) The bar chart represents the relative lipid droplet areas of control and MZglut2 fish after Oil Red O staining (n = 8). A two-tailed unpaired t-test was used to detect significance. ****P < 0.0001.***P < 0.001. **P < 0.01. *P < 0.05. ns, no significance.

