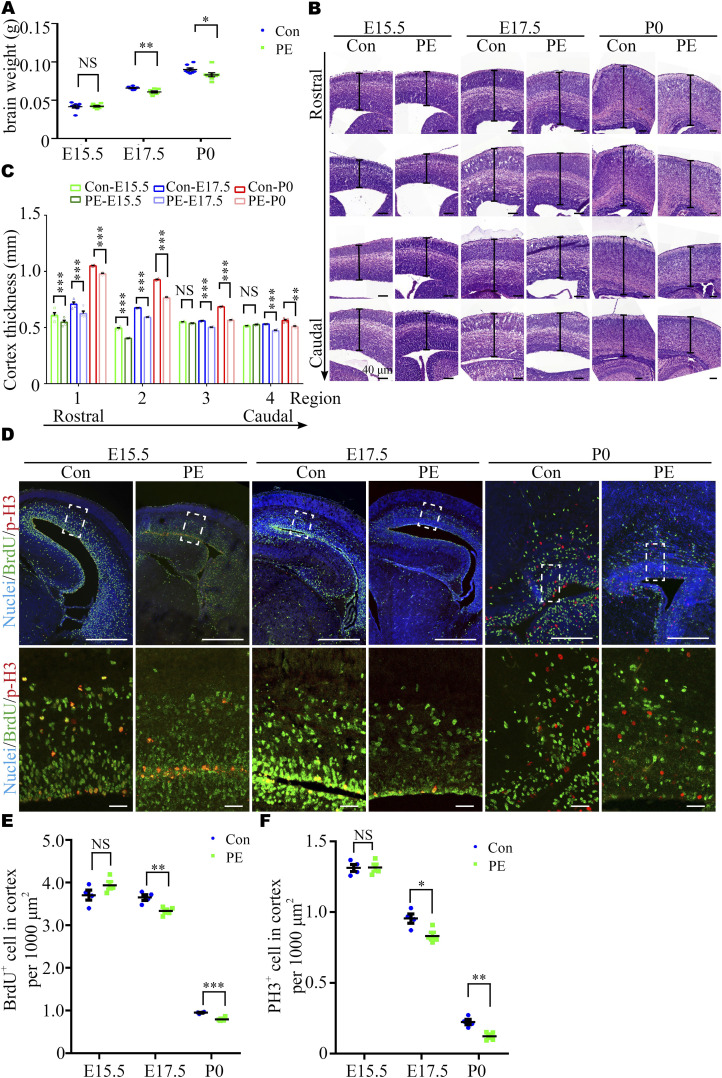
Figure 1. Preeclampsia (PE) progressively results in aberrant brain development.
(A) Brain weight at E15.5 (control, N = 8 litters, n = 65 embryos; PE, N = 8 litters, n = 67 embryos), E17.5 (control, N = 8 litters, n = 66 embryos; PE, N = 8 litters, n = 62 embryos), and P0 (control, N = 8 litters, n = 52 pups; PE, N = 8 litters, n = 55 pups). (B) Coronal sections of E15.5, E17.5, and P0 offspring cortexes stained with hematoxylin and eosin. Scale bar: 100 μm (note different length of scale bars). (C) Graph showing the progressive decrease in the radial thickness in rostral to caudal sections of the cerebral cortex in PE-exposed offspring. Different color dots represent E15.5 (green), E17.5 (blue), and P0 (red) control and PE-exposed offspring, respectively (N = 4 litters, n = 8 offspring brains at each time-point for each group). (D) Confocal micrographs of coronal sections from E15.5 (left), E17.5 (middle), and P0 (right) control and PE-exposed offspring stained with antibodies against BrdU (green) and p-H3 (red). Hoechst 33342 stains nuclei (blue). The lower panels are enlarged images of the regions outlined by white dotted boxes in the upper panels. Scale bar: 50 μm. (E, F) Quantification of the percentage of BrdU+ (E) and p-H3+ (F) cells per 1,000 μm2 (n ≥ 3 brain slices per section from N = 4 litters, n = 8 offspring brains at each time-point for each group). Data are presented as the mean ± s.e.m. NS, P ≥ 0.05; *, P < 0.05; **, P < 0.01;***, P < 0.001, versus control. (A, C, E, F) Multiple t tests with the Holm–Sidak correction for panels (A, C, E, F) based on the number of litter (N).

