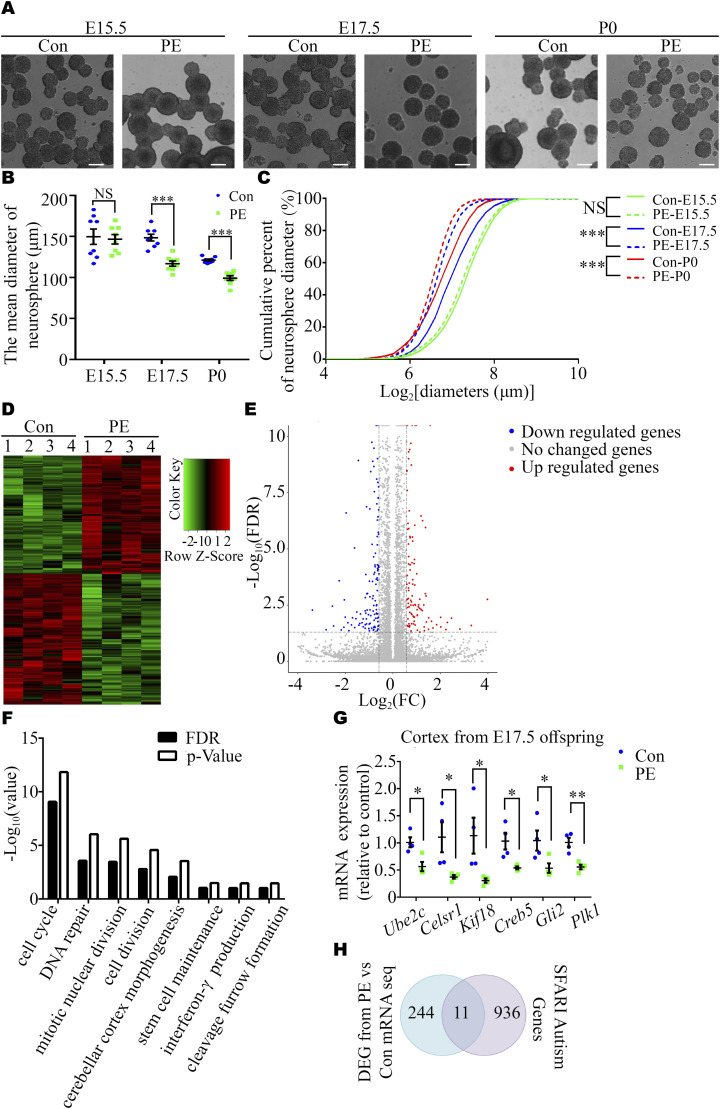
Figure 2. Inhibition of proliferation in cortex-derived NPC from fetal mice derived from PE mouse model pregnancies.
(A) Representative images of primary cortical neurospheres from each group at E15.5, E17.5, and P0. Scale bars: 100 μm. (B) Graph showing the diameter of neurospheres at primary generation at certain time-points (n ≥ 4 cortexes from 4 dams per group at each time-point). (C) Cumulative percent of neurosphere diameters (n = 1767/1767, 3071/3473, and 2324/2913 for control (solid lines) and PE groups (dashed lines) at E15.5 (green), E17.5 (blue), and P0 (red). Note the truncated x-axis. (D, E) Heatmap (D) and a volcano plot (E) showing the 255 DEGs (134 down-regulated and 121 up-regulated DEGs in reference to control samples) in the dorsal cortices of control and PE offspring, as identified by RNA-seq (n = 4 offspring from 4 dams per group). (F) GO enrichment analysis of the 134 down-regulated DEGs (FDR<0.05). (G) qRT-PCR revealed the decreased expression of six genes associated with the biological functions of cell cycle and stem cell maintenance. (H) SFARI genes were significantly overrepresented in the DEG dataset (P = 0.017). Data are presented as the mean ± s.e.m. NS, P ≥ 0.05; *, P < 0.05; **, P < 0.01;***, P < 0.001, versus control. (B, G) Multiple t tests with the Holm–Sidak correction for panels (B, G). (C) Non-parametric Kolmogorov–Smirnov test for panel (C).

