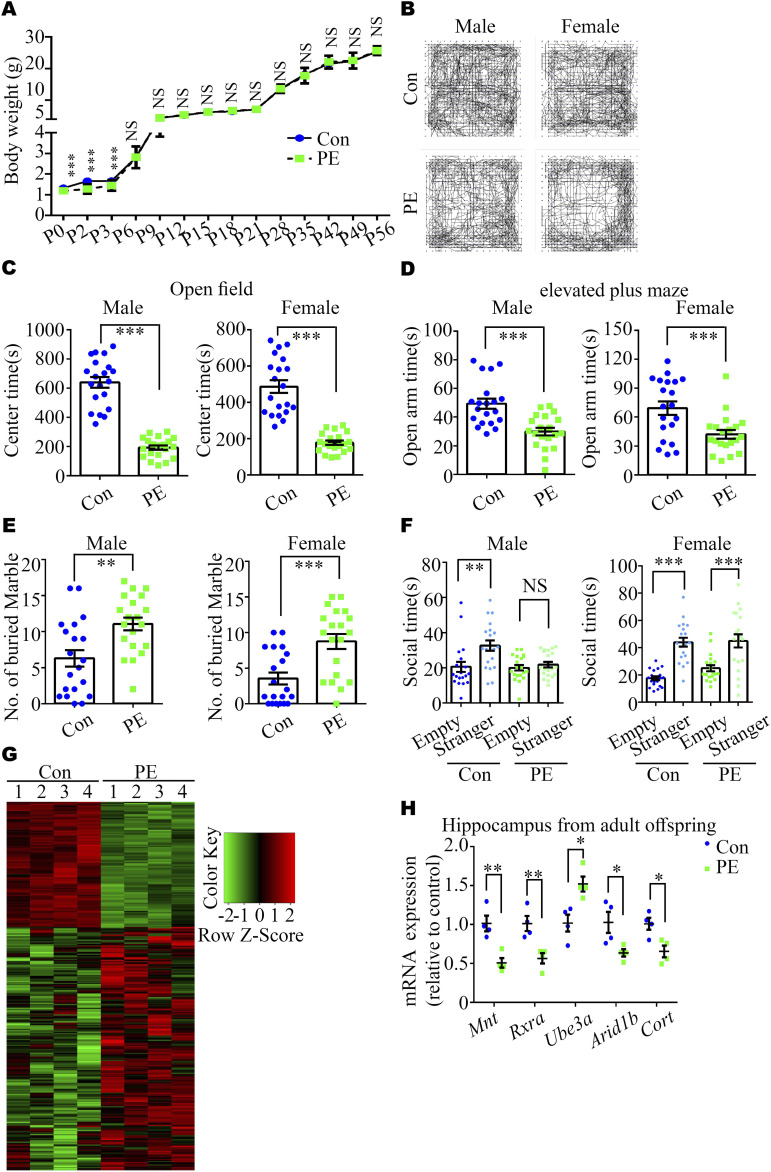
Figure 3. L-NAME–induced PE increased ASD-like behaviors in adult offspring.
(A) Body weight trajectories of control and PE-exposed offspring (n = 62 control and n = 51–62 PE pups from 8 litters per group at each time-point). (B) Representative images of video tracking of control and PE-exposed adult offspring mice in the OFT. (C, D, E, F) Time spent in the center area in the OFT (C) and the open arm of EPM (D), the number of buried marbles (E), and the social time for the three-chamber test (F) in the control and PE-exposed adult offspring mice (left panel, male; right panel, female) (n = 20 offspring from 5 litters for each sex per group). (G) Heatmap showing 317 (108 down-regulated and 209 up-regulated) DEGs in the hippocampi of control and PE-exposed offspring, as identified by RNA-seq (n = 4 offspring from 4 litters per group). (H) qRT-PCR revealed the decreased expression of five genes associated with the etiology of ASD (n = 4 offspring from 4 litters per group). Data are presented as the mean ± s.e.m. NS, P ≥ 0.05; *, P < 0.05; **, P < 0.01; ***, P < 0.001, versus control. (A, H) Multiple t tests with the Holm–Sidak correction for panels (A, H). Unpaired test for panels (C, D, E). (F) One-way ANOVA, Tukey’s HSD test for panel (F).

