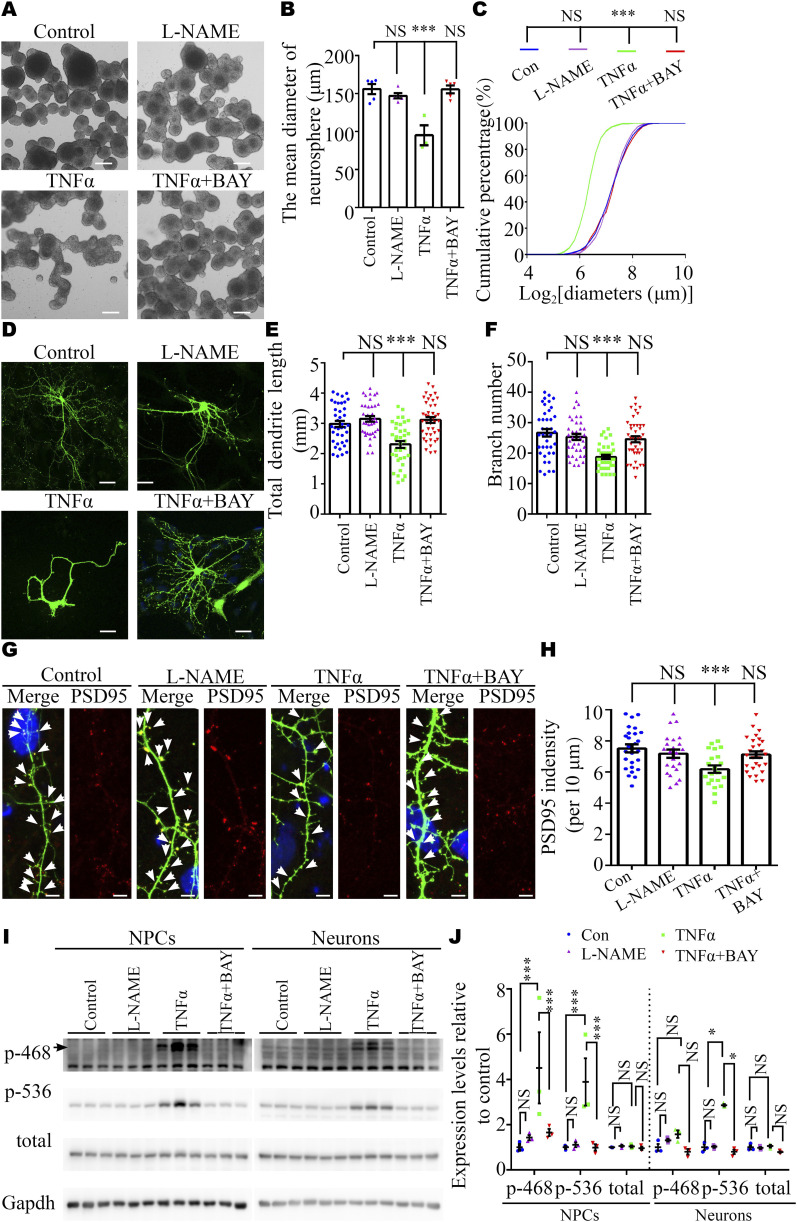
Figure 5. TNFα, but not L-NAME, inhibited the self-renewal of NPC and neurite and synaptic development in vitro.
(A) Representative images of primary neurospheres from E17.5 embryos treated with L-NAME, TNFα (10 ng/ml), or TNFα (10 ng/ml) + BAY 11-7082 (10 μM). Scale bar: 100 μm. (B) Graph showing the diameter of neurospheres (n = 6, 6, 3, and 6 replicates for control, L-NAME, TNFα, and TNFα+ BAY 11-7082 groups, respectively). (C) Cumulative percentages of neurospheres of various diameters (n = 438–1250 neurospheres). Note the truncated x-axis. (D) Representative images of immunostaining of GFP in cultured E17.5 cortical neurons. Scale bar: 20 μm. (D, E, F) Analysis of dendritic length and branch number of neurons in panel (D) (n = 39, 37, 38, and 42 neurons in control, L-NAME, TNFα, and TNFα+ BAY 11–7082 groups, respectively; N = 4 independent experiments). (G) Representative images of immunostaining of GFP (green) and PSD95 (red) in cultured E17.5 cortical neurons. Scale bar: 5 μm. (G, H) Quantitative analysis of PSD95 density in panel (G) (counted neuron numbers, n = 26, 23, 21, and 28 neurons in control, L-NAME, TNFα, and TNFα+ BAY 11-7082 groups, respectively; N = 4 independent experiments). (I, J) Representative Western blotting images (I) and a graph (J) showing phosphorylated NFκB expression in NPCs (left panel) and neurons (right panel) (N = 3 independent experiments). Data are presented as the mean ± s.e.m. NS, P ≥ 0.05; **, P < 0.01; ***, P < 0.001, versus control. (B, C, E, F, H, J) One-way ANOVA, Tukey’s HSD for panels (B, E, F, H); non-parametric Kolmogorov–Smirnov test for panel (C); two-way ANOVA, Tukey’s HSD for panel (J).

