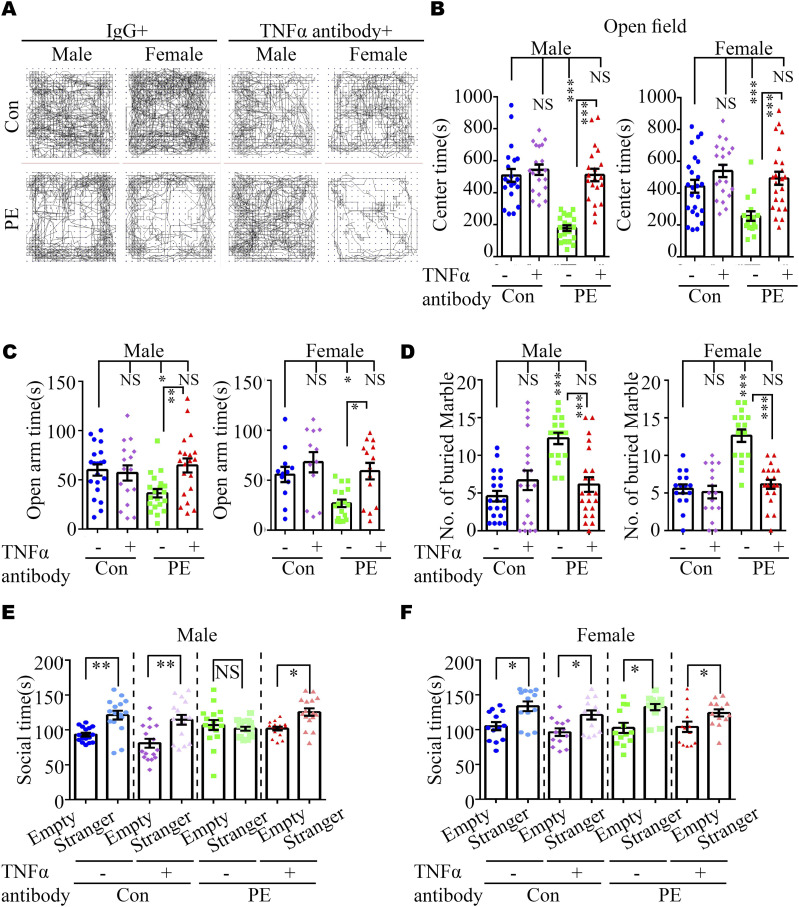
Figure 6. Neutralization of TNFα in maternal serum ameliorated ASD-like phenotypes and suppressed NFκB signaling in the PE-exposed offspring.
(A) Video tracking of adult offspring mice in control+IgG, control+TNFα antibody, PE+IgG, and PE+TNFα antibody groups in the OFT. (B, C, D, E, F) Time spent in the center area in the OFT (B) (n = 20 male offspring from 5 litters per group and n = 24, 20, 24, and 16 female offspring from 4–6 litters for control+IgG, control+TNFα antibody, PE+IgG, and PE+TNFα antibody groups, respectively) and the open arm of EPM (C) (n = 20, 16, 20, and 20 male offspring from 4–5 litters and 20, 16, 20, and 16 female offspring from 4–5 litters for control+IgG, control+TNFα antibody, PE+IgG, and PE+TNFα antibody groups, respectively); the number of buried marbles (D) (n = 20, 20, 16, and 22 male offspring from 4–5 litters and 16, 16, 16, and 20 female offspring from 4–5 litters for control+IgG, control+TNFα antibody, PE+IgG, and PE+TNFα antibody groups, respectively) (left panel, male; right panel, female); and the social time for the three-chamber test (E, F) (n = 16 offspring per sex per group from 4 litters) for offspring, derived from control+IgG, control+TNFα antibody, PE+IgG, and PE+TNFα antibody groups, respectively. Data are presented as the mean ± s.e.m. NS, P ≥ 0.05; *, P < 0.05; **, P < 0.01; ***, P < 0.001, versus control. (B, C, D, E, F) One-way ANOVA, Tukey’s HSD for panels (B, C, D, E, F).

