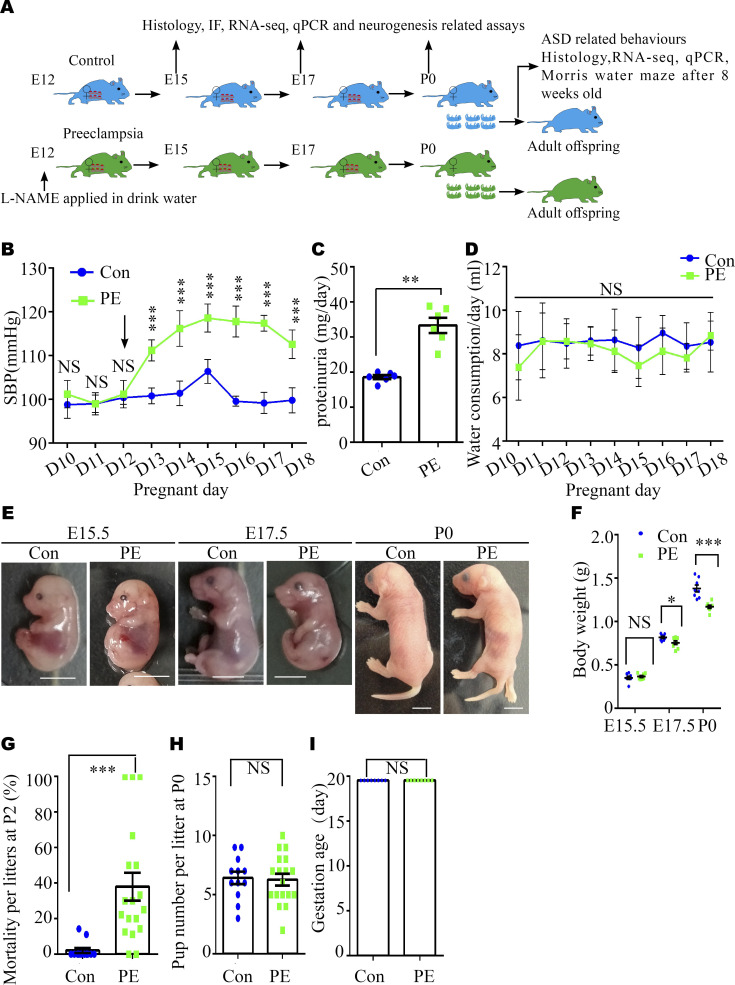
Figure S1. Alterations in the body weight and mortality of offspring from pregnant mice with PE.
(A) Experimental scheme. (B) Systolic blood pressure of pregnant mice in the control (blue solid square) and PE group (green solid triangle). n = 5 dams per group. The black arrow indicates the first day of L-NAME administration in the PE group. Note the truncated y-axis. (C) 24-h proteinuria levels in pregnant mice. N = 6 dams per group. (D) Water consumption of dams per group from pregnancy day 10 through day 18 (N = 5 dams for each group). (E, F) Representative images of embryos (E) and a graph of the weight data for embryos at E15.5 (n = 65 embryos from eight control dams; n = 67 embryos from eight PE dams) and E17.5 (n = 66 embryos from eight control dams; n = 62 embryos from eight PE dams), and P0 pups (n = 52 mice from eight control litters; n = 55 mice from eight PE-exposed litters) (F). Scale bar: 0.5 mm. (G) Statistical analysis of the mortality of control (N = 12) and PE-exposed (N = 18) litters at P2. (H) Graph showing litter size in control (N = 12) and PE groups (N = 18). (I) Graph showing gestation age in control and PE groups (N = 6 dams per group). Data are presented as the mean ± s.e.m. NS, P ≥ 0.05; *, P < 0.05; **, P < 0.01;***, P < 0.001, versus control. (B, D, F) Multiple t tests with the Holm–Sidak correction for panels (B, D, F) based on the number of litter (N). (C, H) Unpaired test for panels (C, H). (G) Mann–Whitney U test for panel (G). (I) Wilcoxon signed-rank test for panel (I).

