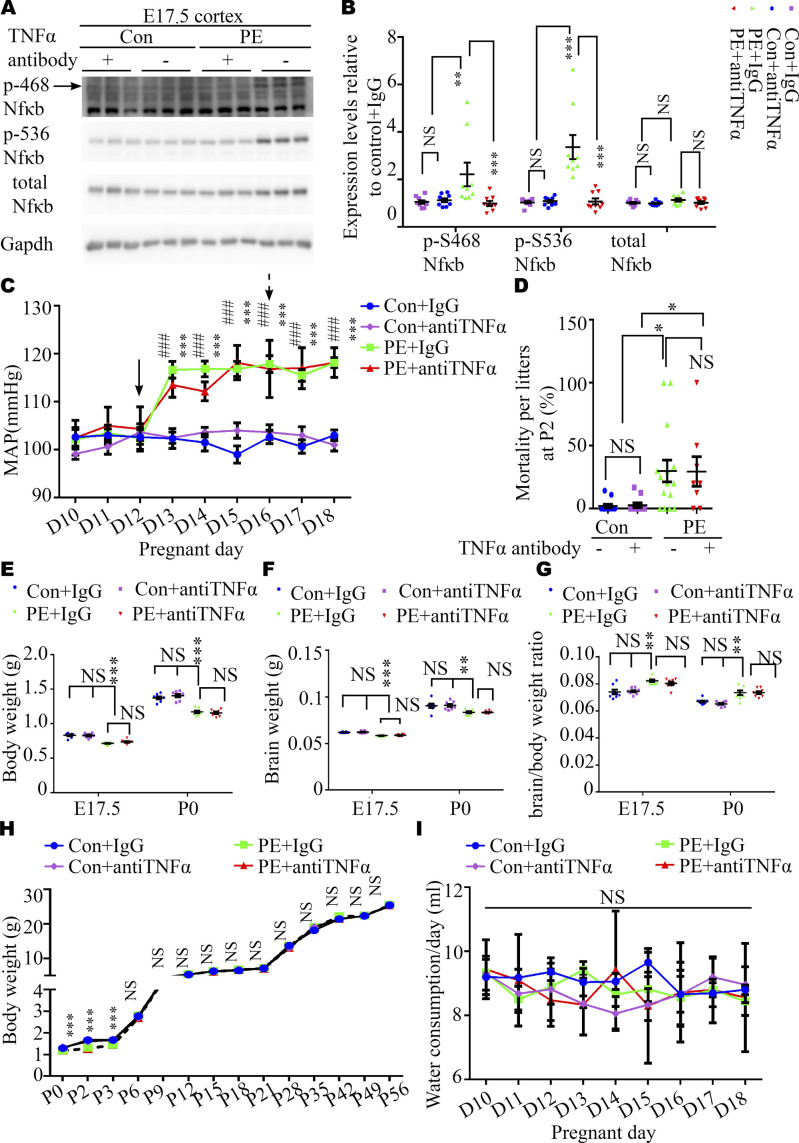
Figure S11. Neutralization of TNFα in maternal circulation did not rescue blood pressure or intrauterine growth restriction.
(A, B) Representative Western blotting images (A) and a graph (B) showing phosphorylated NFκB in the cortices of fetuses from control and PE mothers with/without TNFα antibody at E17.5 (n = 2–3 fetuses from 4 dams per group). (C) SBP of pregnant mice in control+IgG (blue square), control+TNFα antibody (purple diamond), PE+IgG (green square), and PE+TNFα antibody (red triangle) groups. N = 6 dams per group. Black solid and dashed arrows indicate the first day of L-NAME administration and the day of TNFα antibody, respectively. (D) Statistical analysis of the mortality of litters from control+IgG (n = 12 litters), control+TNFα antibody (n = 11 litters), PE+IgG (n = 15 litters), and PE+TNFα antibody (n = 8 litters) groups on P2. (E, F, G) Graphs showing body weight (E), brain weight (F), and brain/body weight ratio (G) at E17.5 (n = 56, 58, 62, and 57 offspring for each group from eight dams per group) and P0 stages (n = 59, 60, 59, and 64 offspring for each group from eight dams per group). (H) Body weight trajectories of offspring per group (n = 55 control+IgG, 50 control+antibody, 47–57 PE+IgG, and 43–53 pups from eight litters per group at each time-point). (I) Water consumption of dams per group from pregnancy day 10 through day 18. (N = 5 dams for each group). (B, C, H, I) Two-way ANOVA, Tukey’s HSD for panels (B, C, H, I). (D) Kruskal–Wallis with Dunn’s correction test for (D). (E, F, G) One-way ANOVA, Tukey’s HSD for (E, F, G). Data are presented as the mean ± s.e.m. NS, P ≥ 0.05; *, P < 0.05; **, P < 0.01;***, P < 0.001; *, PE+IgG, versus control+IgG; #, PE+TNFα antibody, versus control+IgG.

