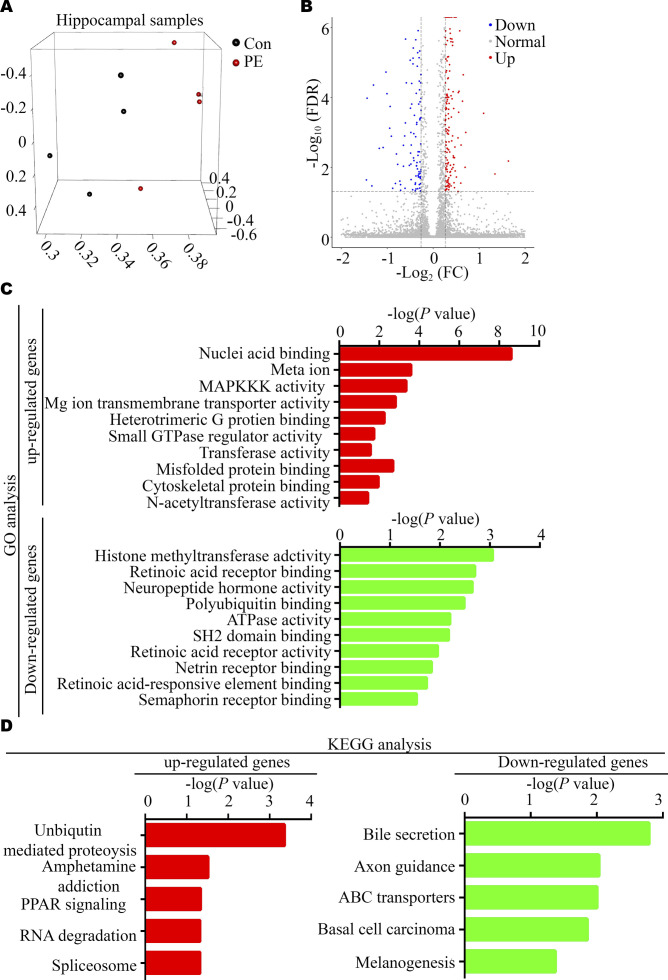
Figure S5. Bioinformatic analyses of DEGs in the hippocampus between control and PE-exposed offspring.
(A) Principal component analysis plot. (B) Volcano plot. (C) GO analysis of up-regulated (red bars, upper panel) and down-regulated DEGs (green bars, lower panel). (D) KEGG pathway analysis of up-regulated (red bars, left panel) and down-regulated DEGs (green bars, right panel).

