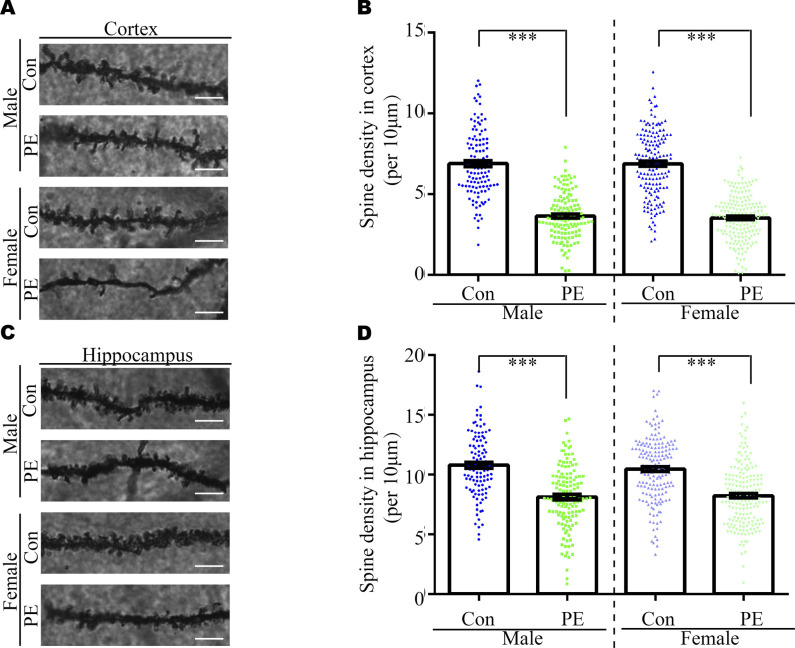
Figure S6. Decreased spine density in cortices and hippocampi of PE-exposed offspring.
(A, C) Representative dendritic segments of Golgi-impregnated layer 2/3 pyramidal neurons in the S1 (primary somatosensory cortex) (A) and CA1 regions (C). (apical dendrite, 2–4 mo of age; scale bar: 5 μm). (B, D) Quantitative analysis of spine density in cortices (B) and hippocampi (D) of control and PE-exposed offspring (n > 20 neurons from three sections of the S1 and CA1 regions per brain from six offspring of both sexes from the control and PE groups). Data are presented as the mean ± s.e.m. ***, P < 0.001, versus control. One-way ANOVA, Tukey’s HSD.

