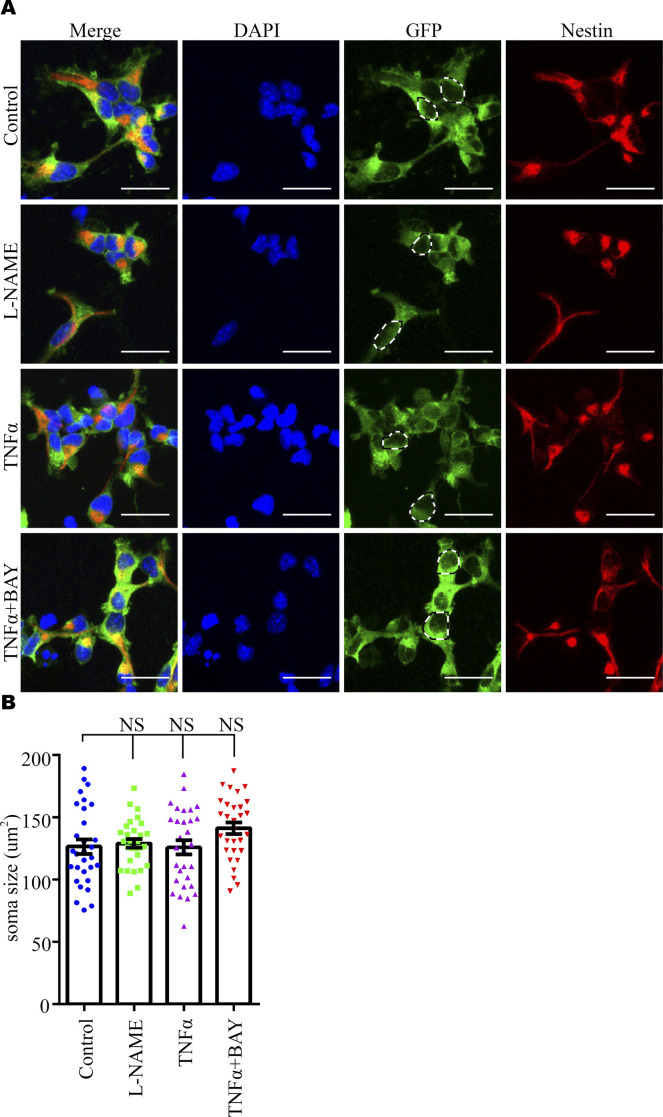
Figure S7. Soma size of cultured neuroprogenitor cells under manipulation of the NFκB signaling pathway.
(A) Representative images of immunostaining of GFP (green) and Nestin (red) in cultured E17.5 neuroprogenitor cells. Scale bar: 10 μm. (A, B) Quantitative analysis of soma size in panel (A). The dashed lines indicate the regions where the measurements were taken (counted neuroprogenitor cell numbers, n = 30 in each group from N = 3 independent experiments). Data are presented as the mean ± s.e.m. NS, P > 0.05, versus control. One-way ANOVA, Tukey’s HSD.

