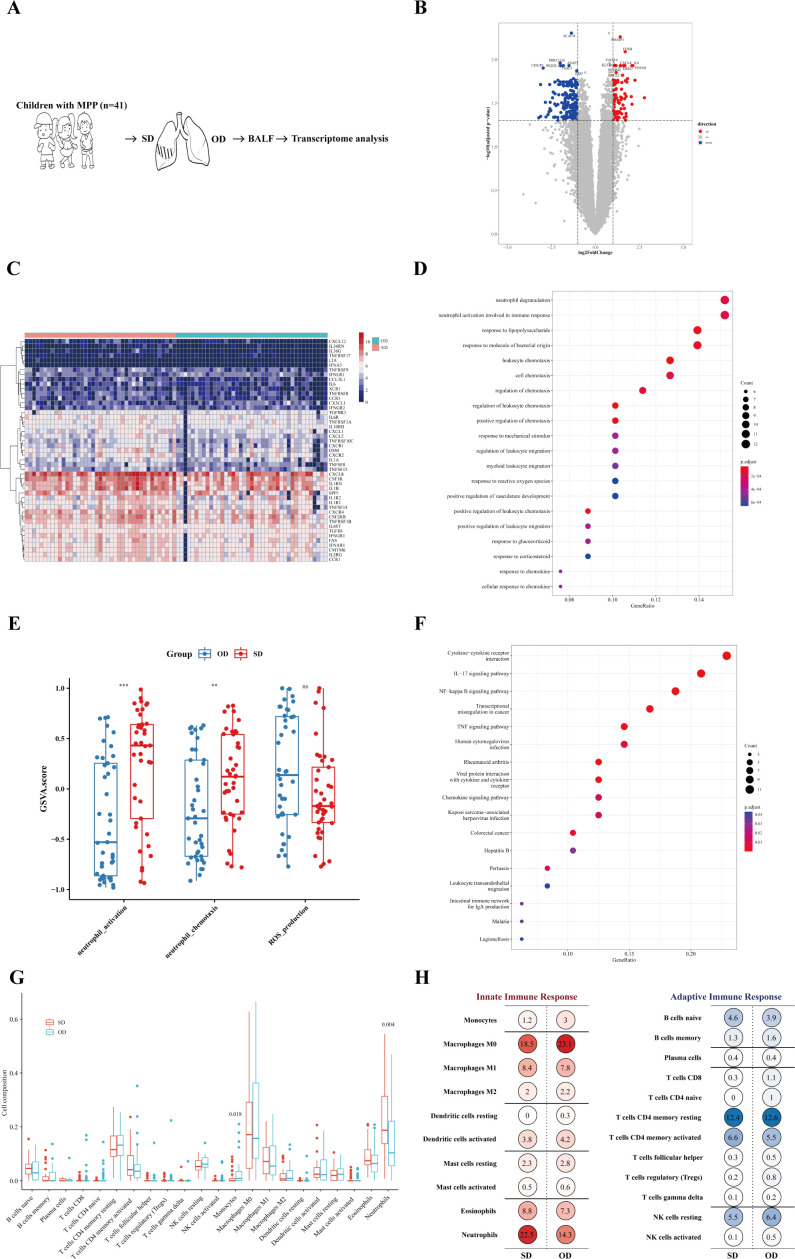
Figure 2.
Neutrophil activation was more significant in the SD of MPP. (A) Introduction to the specific process. (B) Volcano map of differentially expressed genes. Fold change was the ratio of the average expression of genes in the SD group to those in the OD group, and an adjusted p value was obtained by the multiple hypothesis test, Benjamini-Hochberg method. The absolute value of fold change = 1 and the adjusted p value = 0.05 were used as cutoff values to determine the differentially expressed genes (DEGs). When log2 (fold change) > 1 and adjusted p value < 0.05, DEGs were considered as upregulated. The DEGs of log2 (fold change) < −1 and adjusted p value < 0.05 were considered downregulated. (C) SD vs. OD immune-related DEG heatmap. The heatmap is the log conversion of the DEG expression in each sample. The redder the color, the higher the DEG expression. (D) SD vs. OD upregulated DEG GO_BP dot plot. GO is an abbreviation for Gene Ontology. Biological process (BP) is a vital part of GO. Generatio refers to the ratio of genes enriched in this biological process to all upregulated DEGs. The size of the circle represents the number of enriched genes. Benjamini-Hochberg adjusted p value < 0.05 showed significant enrichment. (E) GSVA analysis. The differences in gene set scores of neutrophil activation and neutrophil chemotaxis are shown in this figure. A P value was obtained by Wilcoxon-Mann-Whitney rank-sum test. (F) SD vs. OD upregulated DEG KEGG dot plot. KEGG is an abbreviation of Kyoto Encyclopedia of Genes and Genomes. Generatio refers to the ratio of genes enriched in this functional pathway to all upregulated DEGs. (G) Proportion of pulmonary immune cells in the SD group and OD group based on transcriptome data. The CIBERSORT algorithm with the original CIBERSORT gene signature file LM22 and 1,000 permutations were used to examine the relative proportions of 22 invasive immune cell types in each sample. A P value was obtained by Wilcoxon-Mann-Whitney rank-sum test. (H) Average percentage of immune cells of the innate immune response and adaptive immune response in the SD group and OD group. Red represents innate immune cells, and blue represents adaptive immune cells. The darker the color, the larger the average percentage of the immune cells. *** p < 0.001, ** 0.001 ≤ p < 0.01 and ns p ≥ 0.05.

