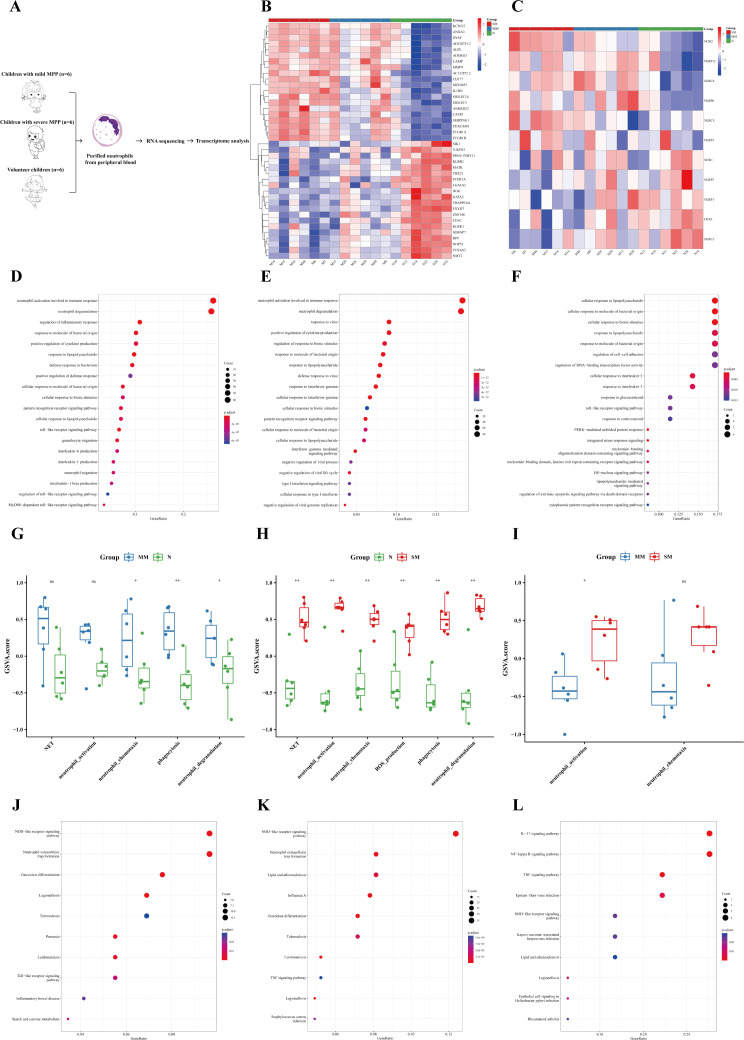
Figure 4.
Neutrophils were more significantly activated in the severe MPP. (A) Introduction to the specific process. (B) Heatmap of differentially expressed genes between the severe MPP group, mild MPP group, and normal group. (C) Heatmap of differentially expressed genes of the NOD-like receiver signaling pathway between the severe MPP group, mild MPP group, and normal group. (D) Mild MPP group vs. Normal group upregulated DEG GO_BP dot plot. (E) Severe MPP group vs. Normal group upregulated DEG GO_BP dot plot. (F) Severe MPP group vs. Mild MPP group upregulated DEG GO_BP dot plot. (G) GSVA analysis between mild MPP and normal controls. The differences in gene set scores of neutrophil activation, neutrophil chemotaxis, neutrophil degranulation, phagocytosis, and NET are shown in this figure. A P value was obtained by Wilcoxon-Mann-Whitney rank-sum test. (H) GSVA analysis between severe MPP and normal controls The differences in gene set scores of neutrophil activation, neutrophil chemotaxis, neutrophil degranulation, phagocytosis, NET, and ROS production are shown in this figure. A P value was obtained by Wilcoxon-Mann-Whitney rank-sum test. (I) GSVA analysis between severe MPP and mild MPP The differences in gene set scores of neutrophil activation and neutrophil chemotaxis are shown in this figure. A P value was obtained by Wilcoxon-Mann-Whitney rank-sum test. (J) Mild MPP group vs. Normal group upregulated DEG KEGG dot plot. KEGG is an abbreviation of Kyoto Encyclopedia of Genes and Genomes. Generatio refers to the ratio of genes enriched in this functional pathway to all upregulated DEGs. (K) Severe MPP group vs. Normal group upregulated DEG KEGG dot plot. (L) Severe MPP group vs. mild MPP group upregulated DEG KEGG dot plot. SM, severe MPP group; MM, mild MPP group; N, Normal group. ** 0.001 ≤ p < 0.01, * 0.01 ≤ p < 0.05 and ns p ≥ 0.05.

