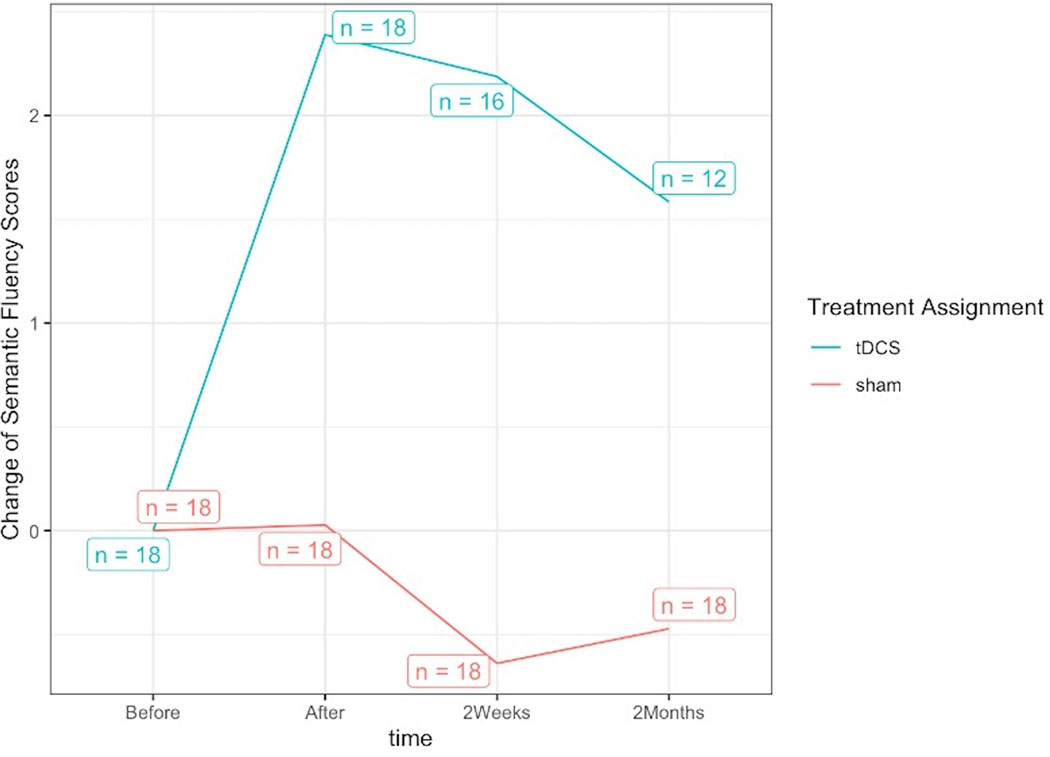
Figure 2.
Observed group average levels of changes in semantic fluency (shown on the ordinate, y-axis) for both the active tDCS and sham conditions. Time points: baseline (Before), immediately after intervention (After), two weeks post intervention (2Weeks) and two months post intervention (2Months) shown in the abscissa (x-axis); the statistical sample (number of patients) is indicated in boxes for both sham and active tDCS. Please refer to results in Section 3.3.1 for estimation and inference adjusting for confounders and missingness at random, where additional tDCS effect was confirmed to be significant immediately after and two weeks post intervention, and marginally significant two months post intervention.

