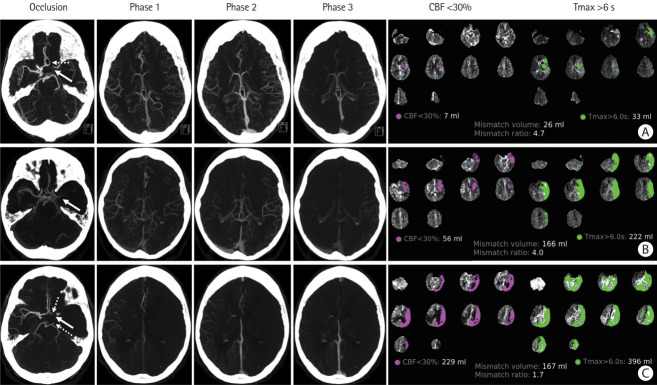
Figure 5.
Examples of patients with acute large vessel occlusion (LVO) and their respective computed tomography agiography (CTA) and computed tomography perfusion studies. Each row sequentially shows axial maximum intensity projection images of the LVO and the three phases of CTA, followed by the ischemic core (defined as cerebral blood flow [CBF] <30% of contralateral side) and penumbra (defined as time-to-maximum [Tmax] >6 s) images with their respective automated volume calculation. (A) Left “T occlusion” (distal internal carotid artery, A1 and M1 segments, arrow) with good collaterals. Notice the filling of the left A2 segment from the contralateral side (dashed arrow). (B) Left M1 occlusion (arrow) with moderate collaterals. (C) Left “T occlusion” (arrow) with poor collaterals. Notice the retrograde filling of the left A1 segment and left posterior communicating artery (dashed arrows).

