
FIGURE 1.
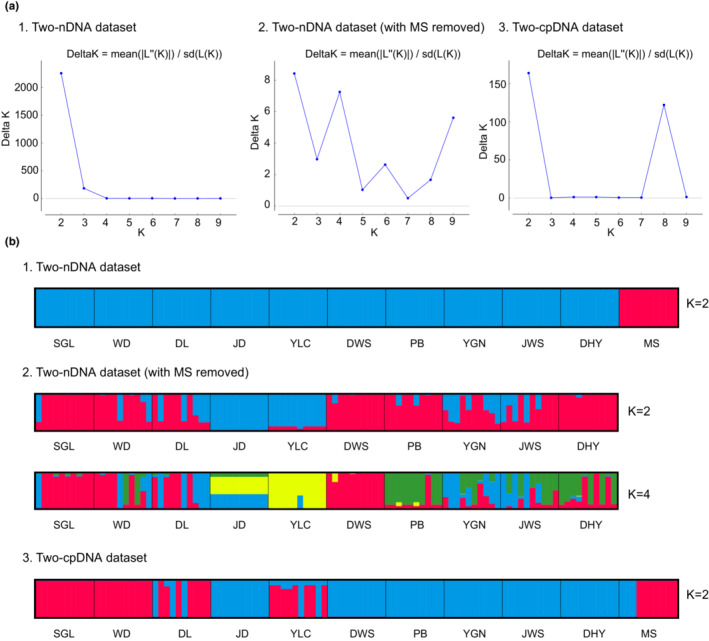
STRUCTURE analyses on the low‐copy nuclear and plastid gene datasets of the Gaultheria leucocarpa group from mainland China. (a‐1) The best‐fit model (ΔK) for the dataset based on concatenated two nuclear genes; (a‐2) the best‐fit model (ΔK) for the dataset based on concatenated two nuclear genes with the data of MS population removed; (a‐3) the best‐fit model (ΔK) for the dataset based on concatenated two‐plastid‐gene regions. (b‐1) The plot of genetic clusters of the two‐nuclear‐gene dataset of all populations at K = 2 (each column/grid represents a population); (b‐2) plots of genetic clusters based on the two‐nuclear‐gene dataset of all populations with MS removed at K = 2 and 4; (b‐3) plot of genetic clusters based on the two‐plastid‐gene dataset of all populations at K = 2.