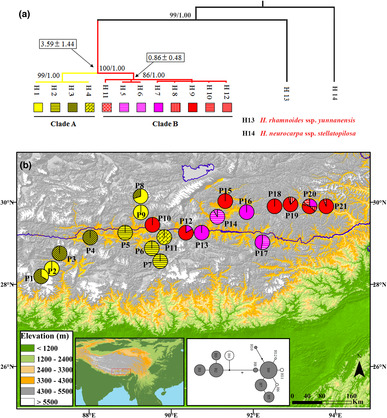
FIGURE 1.

(a) Phylogenetic relationship of cpDNA haplotypes of Hippophae gyantsensis based on maximum likelihood (ML) method. Numbers near the branches are bootstrap values for ML analyses (left) and Bayesian posterior probabilities (right) from left to right; divergence time estimated in million years ago ± SE are given in the rectangular boxes. (b) Geographic locations of cpDNA haplotypes of H. gyantsensis. Pie charts show the proportions of cpDNA haplotypes within each population.
