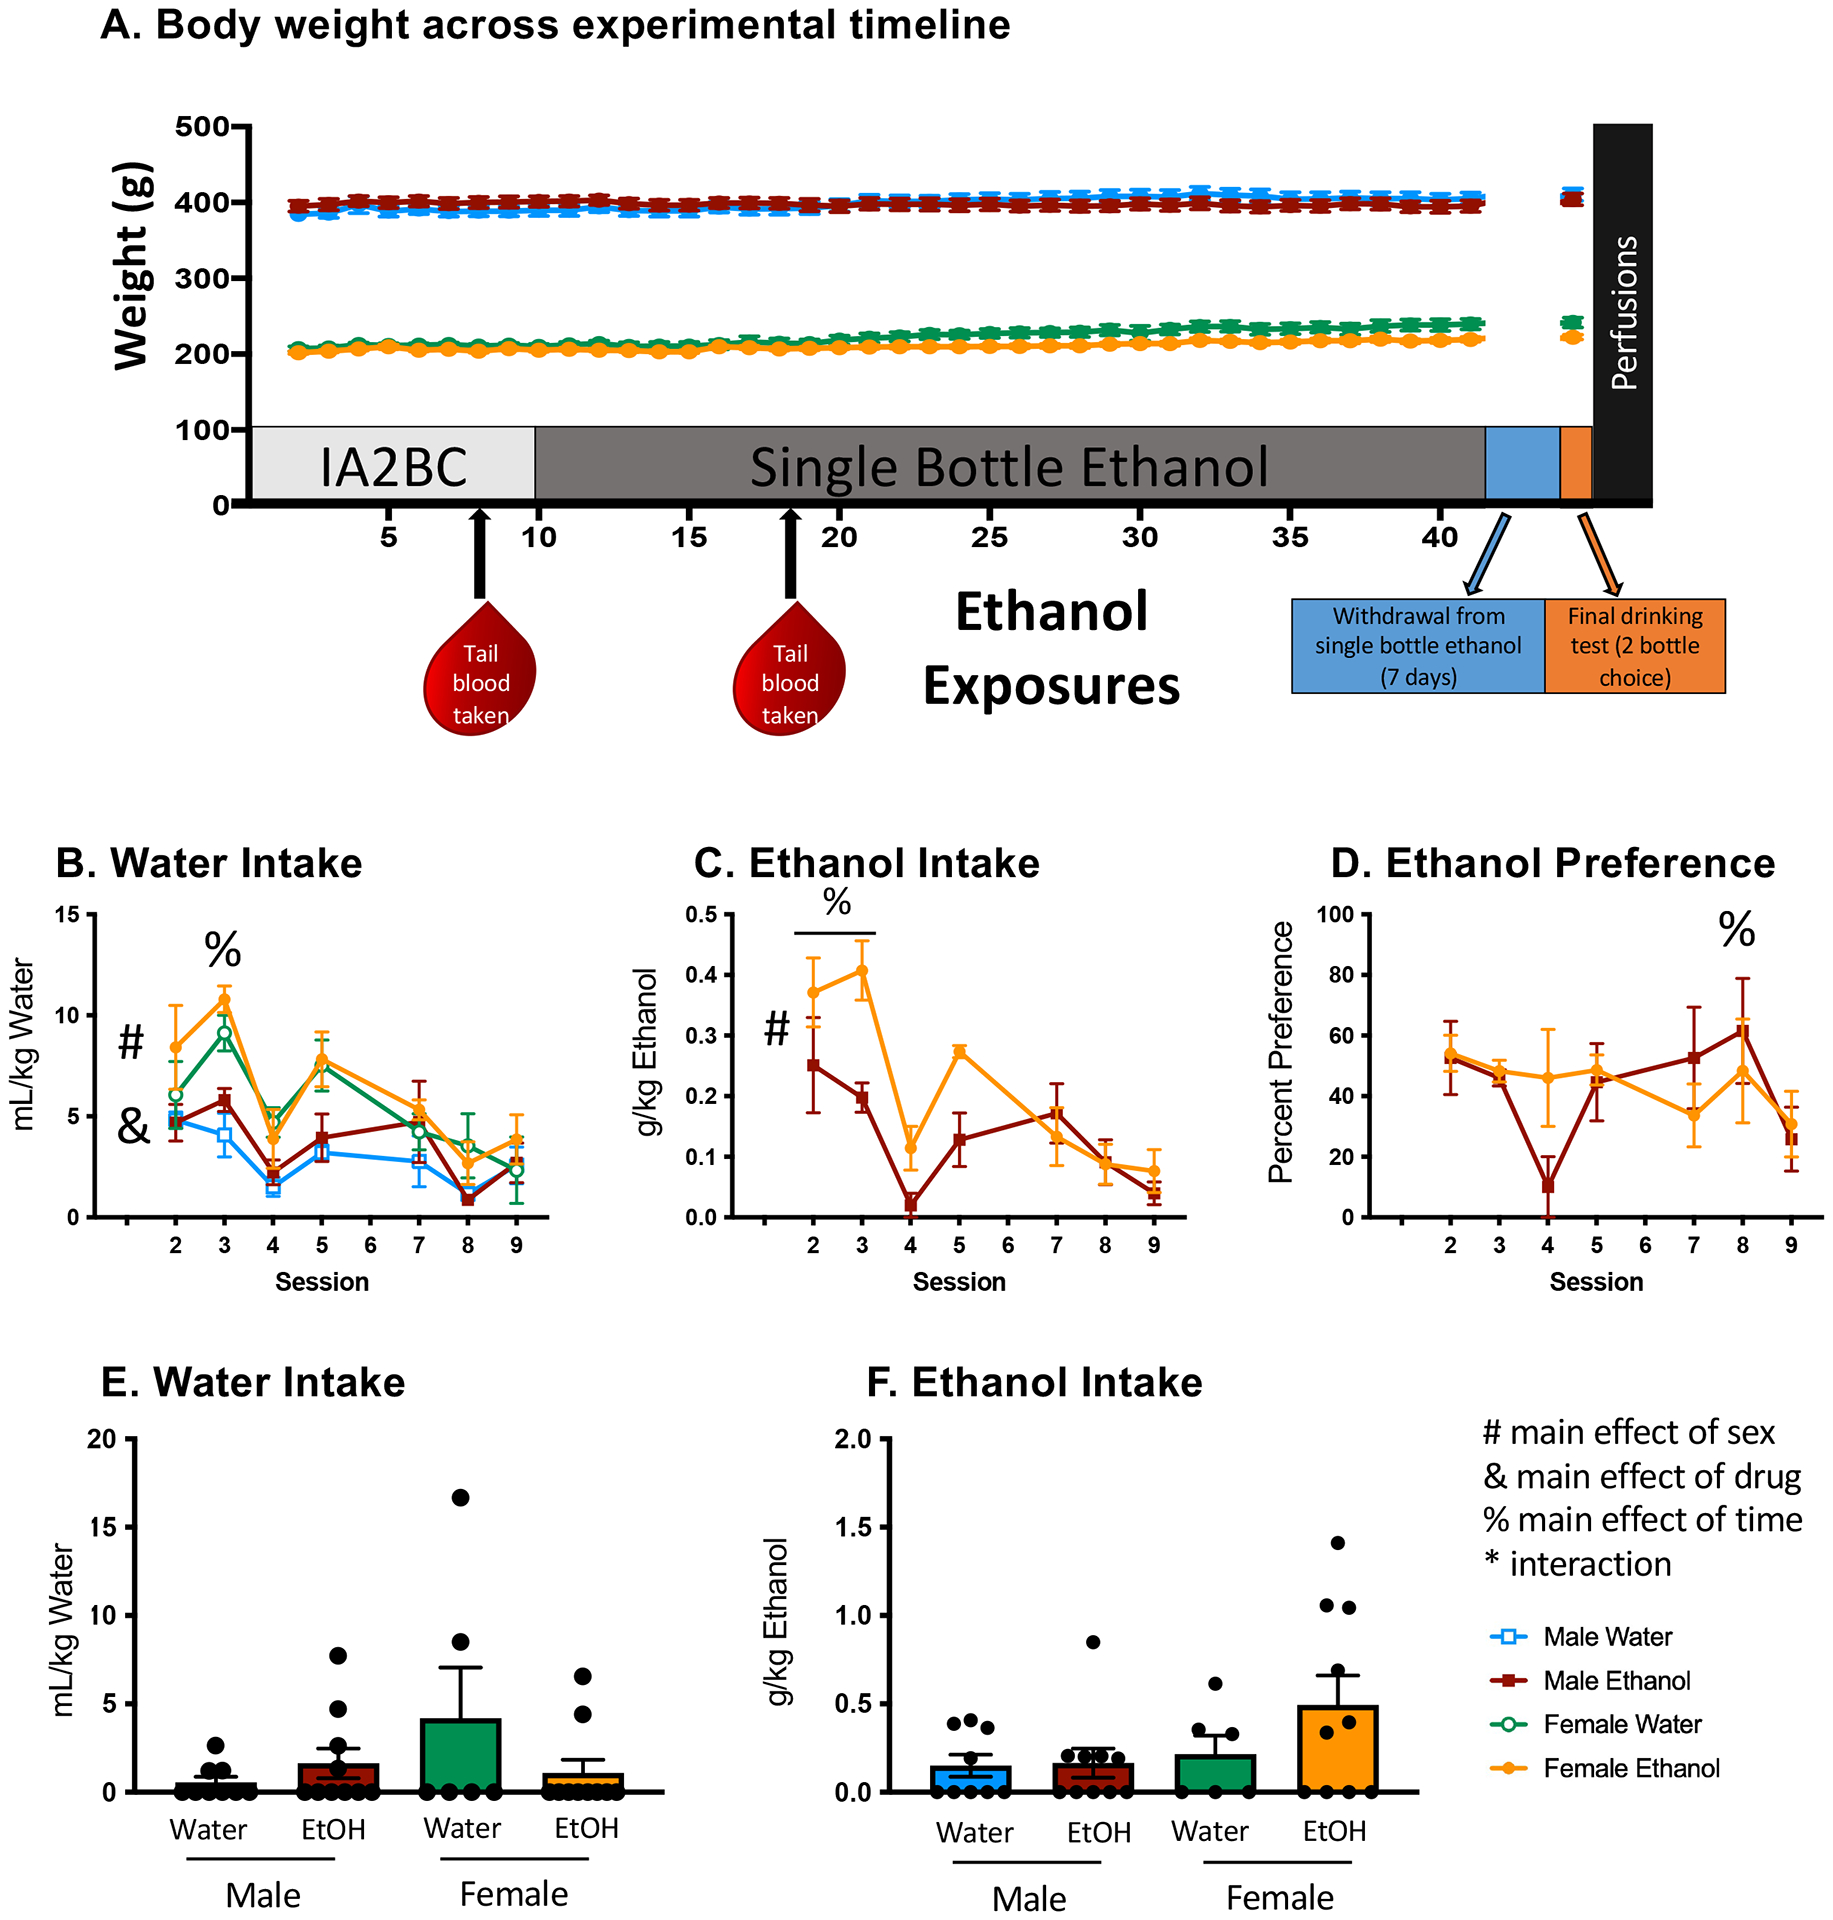
Figure 1. Timeline and behavioral characterization of drinking model.

(A) Body weight in rats across experimental timeline; no weight differences were observed as a result of ethanol consumption. (B) Females consumed more water in mL/kg than males (#), with data collapsed across sessions and exposure condition, and ethanol-exposed animals consumed more water than their water-exposed counterparts (&), with data collapsed across sex and session. Water consumption was highest (%) during session 3. (C) Females consumed more g/kg ethanol than males (#), with data collapsed across sessions, and the highest amounts of ethanol (see %) were consumed during sessions 2 and 3 (D) Preference for ethanol was highest during session 8 (%), but lowest during session 9. (E & F) A final, 30-minute acute drinking test was performed to determine whether ethanol preference had developed. No differences in water intake or ethanol intake were observed during the final drinking test. BECs reported in Table 1. All data expressed as mean ± SEM, alpha set to p = 0.05.
