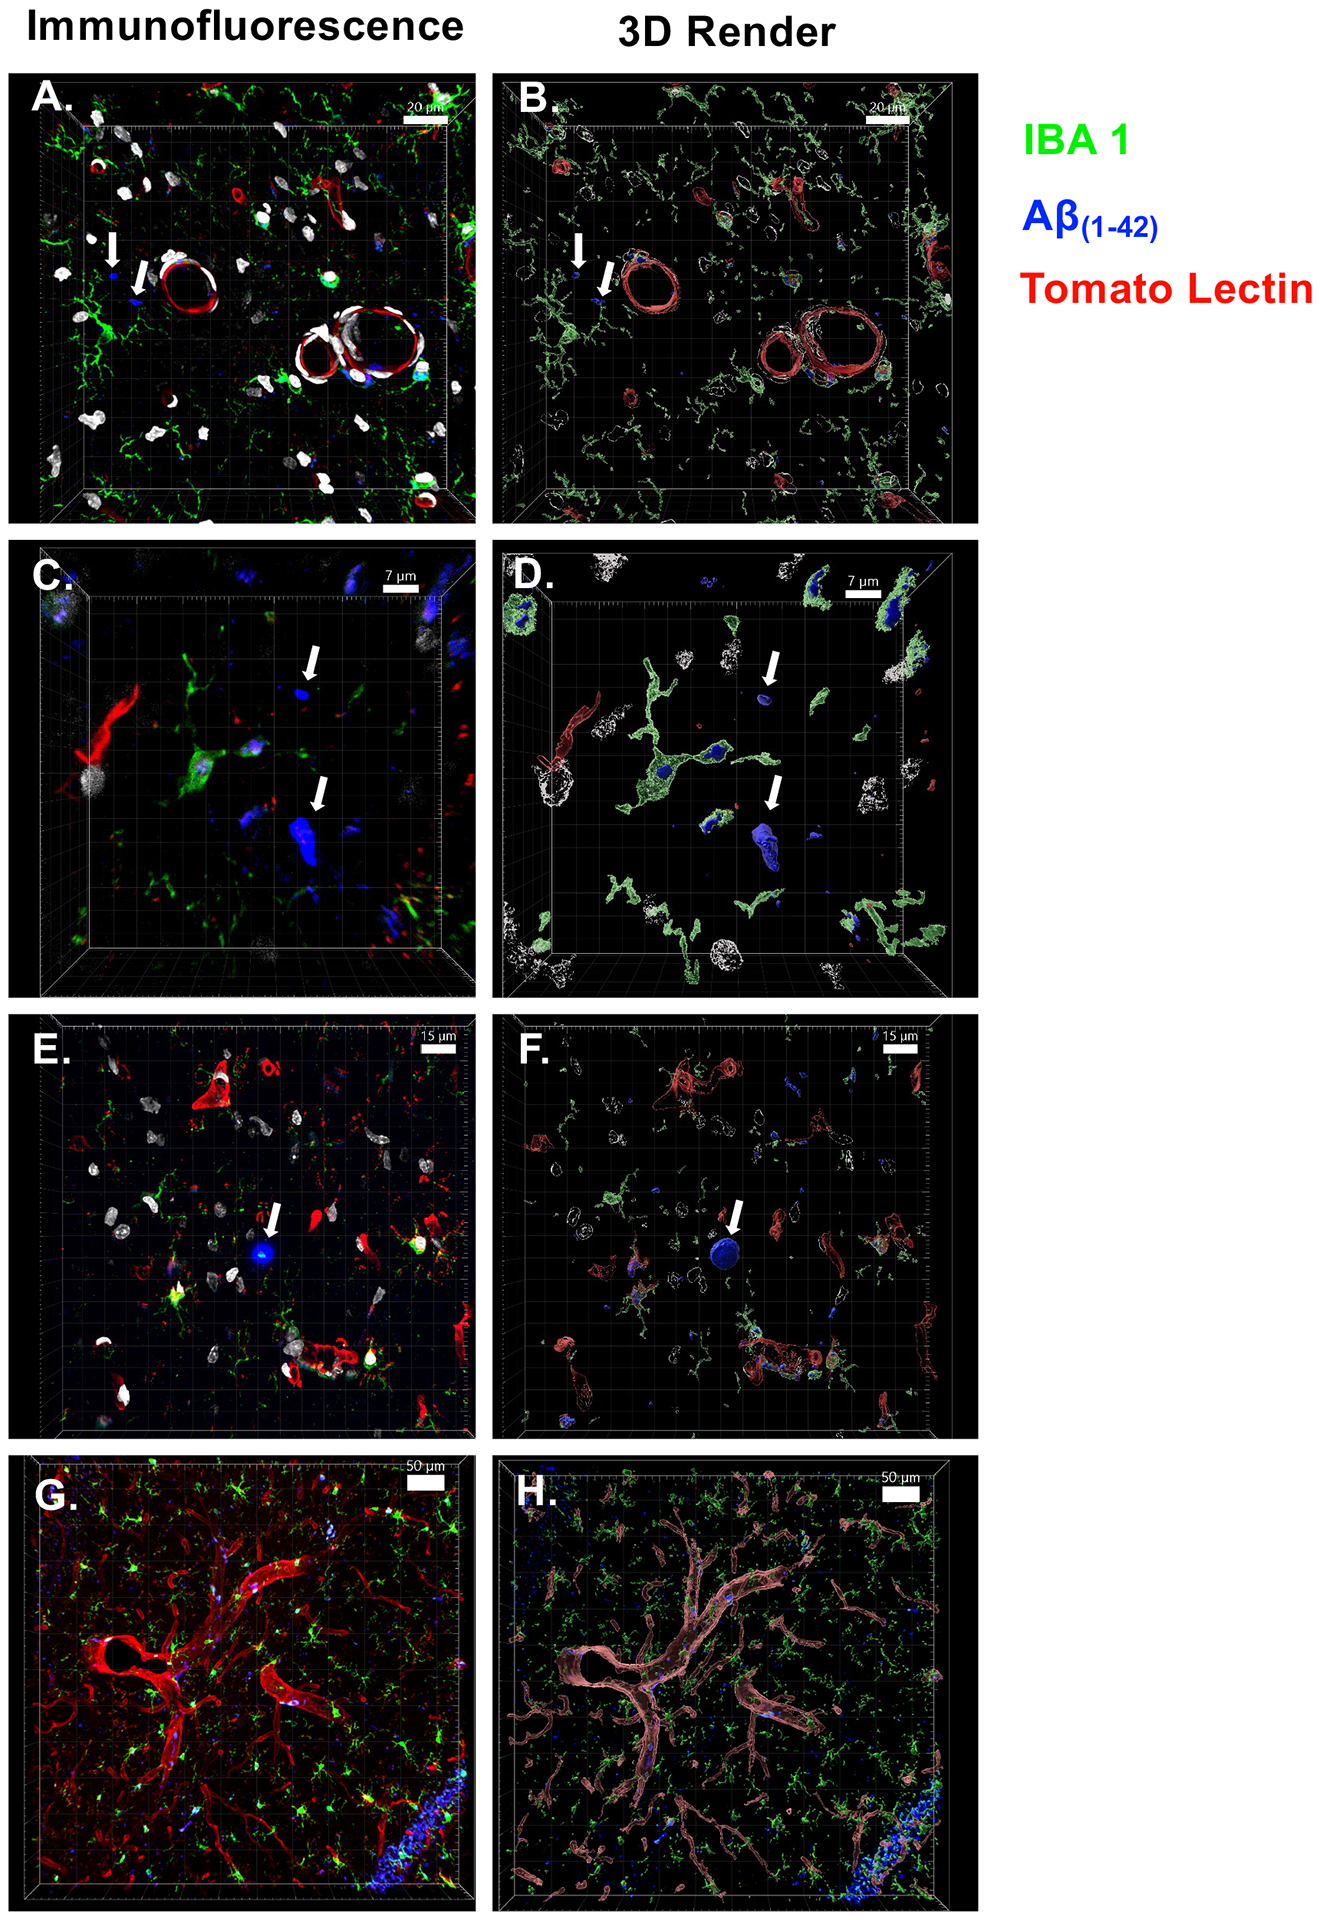
Figure 3. Immunofluorescence and 3D rendering of amyloid beta plaques.

Images to the left are immunofluorescent images taken with a confocal microscope, images to the right are rendered using IMARIS software for improved visual clarity. Arrows denote Aβ fragments and plaques. (A & B) Prodromal Aβ fragments, relatively small (<75 micron2), Aβ primarily found in vascular-bound microglia, captured at 40×. (C & D) Plaque development beginning, roughly the size of a microglial soma (350 micron2), captured at 40×. (E & F) Traditional Aβ plaque, larger than a microglial soma (519 micron2), with high density of Aβ internalized in surrounding microglia, captured at 40×. (G & H) Representative image of microglia-vasculature interaction, captured at 20×. Scale bar is included for size reference in each image.
