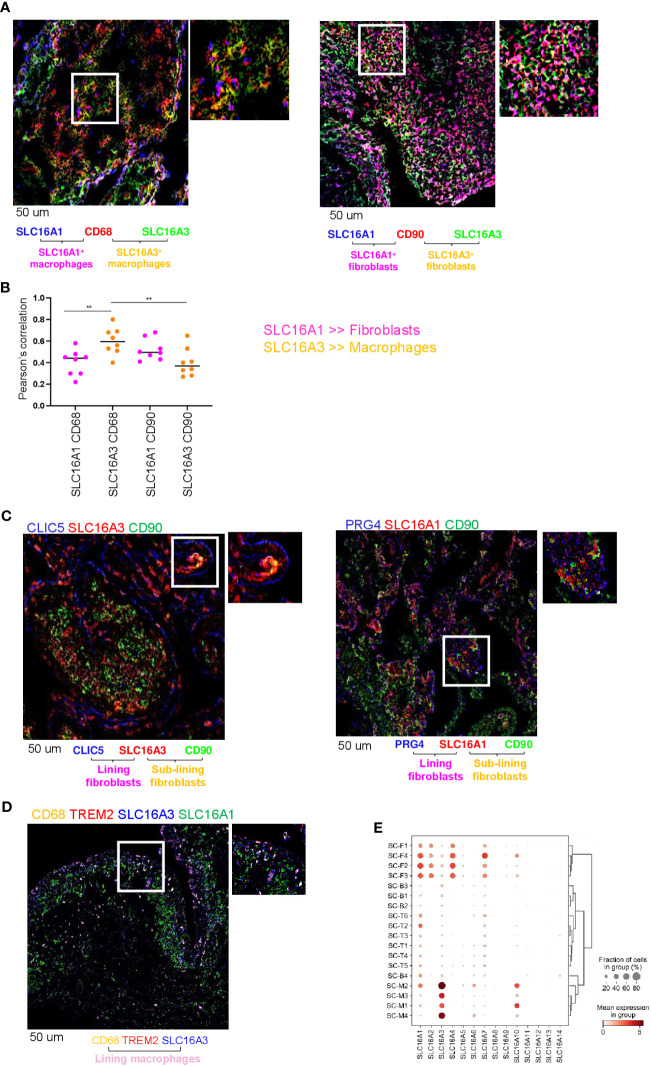
Figure 1.
Lactate transporter expression in synovial compartment. (A) Representative IF staining of SLC16A1 (blue) and SLC16A3 (green) expression by synovial fibroblasts (CD90, red) and macrophages (CD68, red) from n=8 RA synovial tissues. (B) Quantification of the colocalization (Pearson’s correlation coefficient, ref 21) between SLC16A1 (blue) and SLC16A3 (green) and CD90 (red) and CD68 (red) within n=8 RA synovial tissues. Data are expressed as mean ± SEM. Anova test **p < 0.05; (C) SLC16A1 and SLC16A3 expression (red) by sub lining (CD90, green) and lining (CLIC5 or PRG4, blue) fibroblasts. (D) SLC16A1 and SLC16A3 expression (blue and green respectively) by sub lining (CD68+TREM2-, orange) and lining (CD68+TREM2+) macrophages. Scale bar 50 um. (E) scRNAseq expression of lactate transporters in synovial cellular subsets: Fibroblast: sub-lining SC-F1 (CD34+CD90+), SC-F2 (HLA-DRAhighCD90+), SC-F3 (DKK+CD90+) and lining SC-F4 (CD55+CD90-PRG4+CLIC5+) subsets (ref 1, 2). Macrophages: sub-lining MerTKnegTREM2neg SC-M1 (IL-1b+CD14+), SC-M4 (IFN-activated), and lining MerTKposTREM2pos SC-M2 (NUPR1+CD14+), SC-M3 (C1QA+CD14+) subsets (ref 2, 5). T cells: SC-T1 (CCR7+), SC-T2 (Treg cells), SC-T3 (Follicular helper T cells), SC-T4 (Granzyme K+), SC-T5 (Granulysin+, Granzyme B+), SC-T6 (Granzyme K+, Granzyme B+). B cells: SC-B1 (Naïve), SC-B2 (Memory), SC-B3 (Autoimmune), SC-B4 (Plasmablasts) (ref 2). Synovial tissues were taken by RA (n=36) and OA (n=15) patients (AMP dataset,ref 1, 2).

