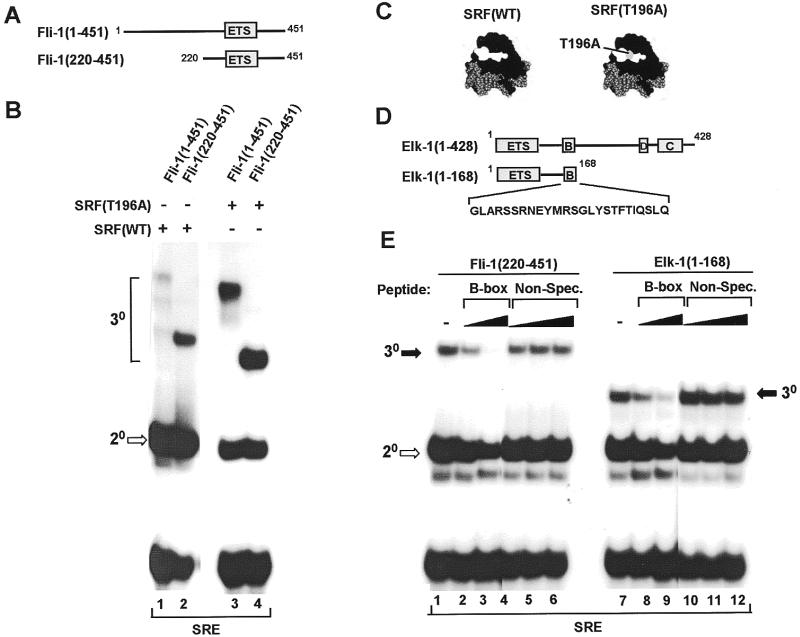
Figure 1.
Fli-1 forms a ternary complex with wild-type SRF and mutant SRF (T196A) at the c-fos SRE. (A) Diagrammatic representation of full-length Fli-1 [Fli-1(1–451)] and the N-terminally truncated derivative Fli-1 (220–451). The ETS DNA-binding domain is shown as a grey box. (B) Gel retardation analysis of ternary complexes formed between the indicated Fli-1 derivatives, wild-type (lanes 1 and 2) and the T196A mutant form (lanes 3 and 4) of coreSRF and the c-fos SRE. Equal molar amounts of each Fli-1 construct were used in all the binding reactions. The location of the ternary (30) Fli-1–SRF–SRE and binary (20) SRF–SRE complexes are indicated by brackets and an open arrow respectively. (C) Structure of SRF (black) bound to the c-fos SRE (grey) (32). Residues comprising the Elk-1 binding surface are shown in white (8). The location of T196 within this surface is shown in grey. (D) Diagrammatic representation of the domain structure of Elk-1 and the truncated derivative Elk-1(1–168). The sequence of the B-box region used to derive peptides for competition assays as shown below these diagrams. (E) Gel retardation analysis of ternary complex formation by Fli-1(220–451) (lanes 1–6) and Elk-1(1–168) (lanes 7–12), wild-type coreSRF and the c-fos SRE in the presence of increasing amounts of competitor B-box peptide (120 pmol, lanes 1 and 8; 600 pmol, lanes 2 and 9) or a non-specific peptide (12 pmol, lanes 4 and 10; 600 pmol, lanes 5 and 11; 6 nmol, lanes 6 and 12). The locations of binary (20, open arrows) SRF–SRE and ternary (30, closed arrows) Elk-1/Fli-1–SRF–SRE complexes are indicated.

