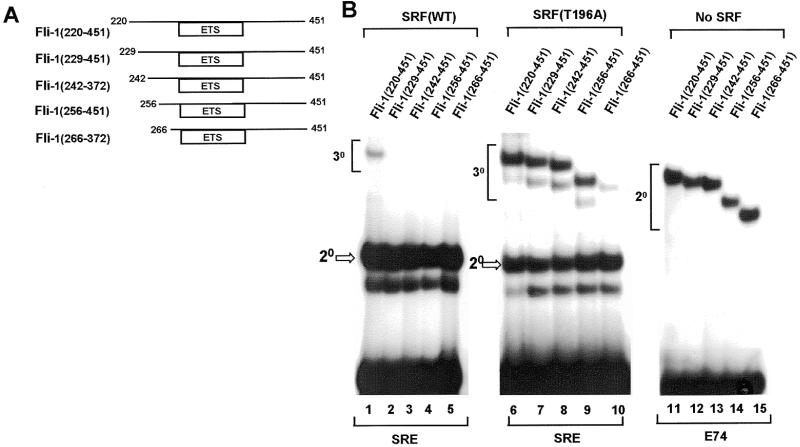
Figure 3.
Mapping of the N-terminal SRF binding motif. (A) Diagrammatic representation of N-terminally truncated Fli-1 proteins. Numbers represent the first and last amino acids in each construct. (B) Gel retardation analysis of ternary complex formation by the indicated Fli-1 derivatives, wild-type coreSRF (lanes 1–5), mutant coreSRF(T196A) (lanes 6–10) and the c-fos SRE. Binary complex formation by the same Fli-1 proteins with the E74 site in the absence of coreSRF is shown in lanes 11–15.

