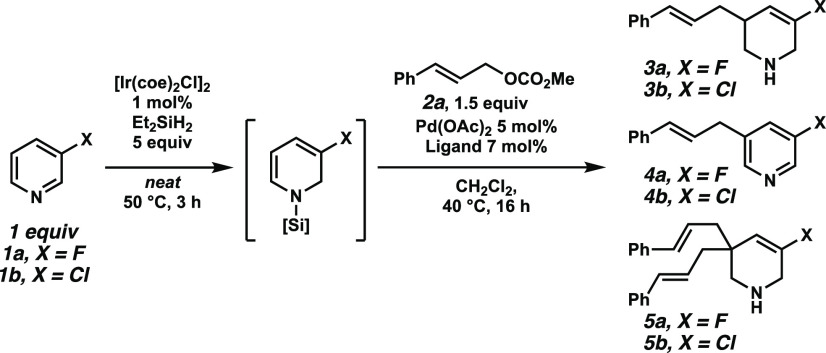
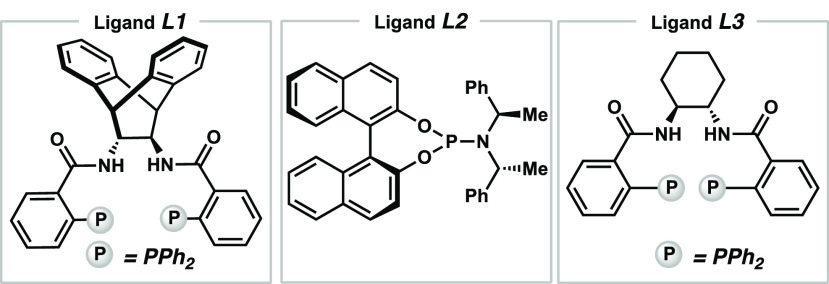
Table 1. Selected Optimization Reactionsa.
| # | deviation from standard reaction conditions | L | 3 (% ee) | 4 | 5 |
|---|---|---|---|---|---|
| 1 | Pd2(dba)3 2.5 mol % | PPh3 | 2 (n.d.) | 11 | <5 |
| 2 | Pd2(dba)3 2.5 mol % | L1 | <5 (30) | <5 | <5 |
| 3 | Pd2(dba)3 2.5 mol % | L2 | <5 (48) | <5 | |
| 4 | L3 | 38 (96) | 8 | 5 | |
| 5 | Pd2dba3·CHCl3 2.5 mol % | L3 | 38 (96) | 9 | 10 |
| 6 | Pd2dba3 2.5 mol % in PhH | L3 | 18 (98) | 11 | <5 |
| 7 | NaF 10 mol % | L3 | 49 (96) | 8 | 6 |
| 8b | Et2SiH2 2.5 equiv, NaF 10 mol % | L3 | 29 (n.d.) | 38 | 29 |
| 9b | [Ir] 2.5 mol %, NaF 10 mol % | L3 | 5 (n.d.) | <5 | <5 |
| 10b | [Ir] 0.5 mol %, NaF 10 mol % | L3 | 14 (n.d.) | 34 | 45 |
Reaction conditions: first step = 1a (0.2 mmol), Et2SiH2 (5 equiv), [Ir(coe)2Cl]2 (1 mol %), 50 °C, 3 h; second step = 2a (1.5 equiv), Pd(OAc)2 (5 mol %), L6 (7 mol %), CH2Cl2 (0.2 M), 40 °C, 16 h. LC/UV–vis yields were determined via calibration curve obtained using isolated products. L = ligand; n.d. = not determined.
3-Chloropyridine (1b) was used as substrate.


