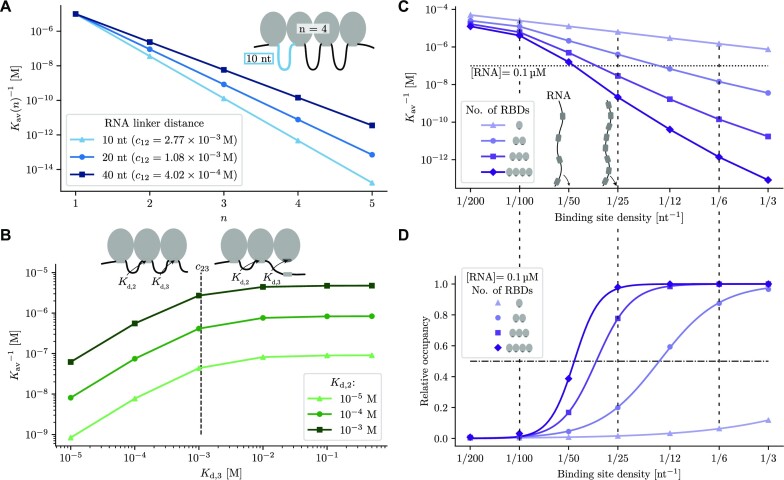
Figure 5.
Dependence of the avidity (effective association constant) of RBPs on the number of RBDs, their Kd’s, the effective local concentrations cij, and the binding site density on the RNA. (A) The inverse avidity  decreases exponentially with the number of binding domains n, because each added binding site multiplies the avidity by ∼Ka, i times the local concentration ci − 1, i of the free i’th RNA binding site at the site of the i’th free RBD (equation 4). The slope thus depends on the spacing of binding sites via ci − 1, i. All RBD Kd’s were set to 10 μM and distances d between rigidly linked binding domains to 2 nm. (B) Individual RBDs contribute proportionally to the total avidity as long as their Kd, i is less than the local concentration,
  (here shown for i = 3). The Kd for the first domain is Kd, 1 = 10 μM, the Kds for the second and third domain are varied as indicated.
  was calculated for equal distances between rigidly linked binding domains of 2 nm and an RNA linker length of 20 nt. (C) The inverse avidity decreases with the binding site density on the RNA. For this plot, we approximately neglect non-sequential binding modes, which are much less populated than the sequential ones. Kds of individual domains were 50 μM and the total RNA length was 200 nt. The horizontal line indicates a concentration of 0.1 μM used for the calculations in (D). (D) Binding probability of RBPs as measured by
  as a function of binding site density on the RNA at an RNA concentration of 0.1 μM (horizontal line in (C)). Curves show fits with sigmoidal Hill-functions, with Hill coefficients of h1 = 0.99, h2 = 2.35, h3 = 4.01 and h4 = 5.7 for one to four domains, respectively. Note the strongly cooperative, switch-like behaviour for n = 4 RBDs.

