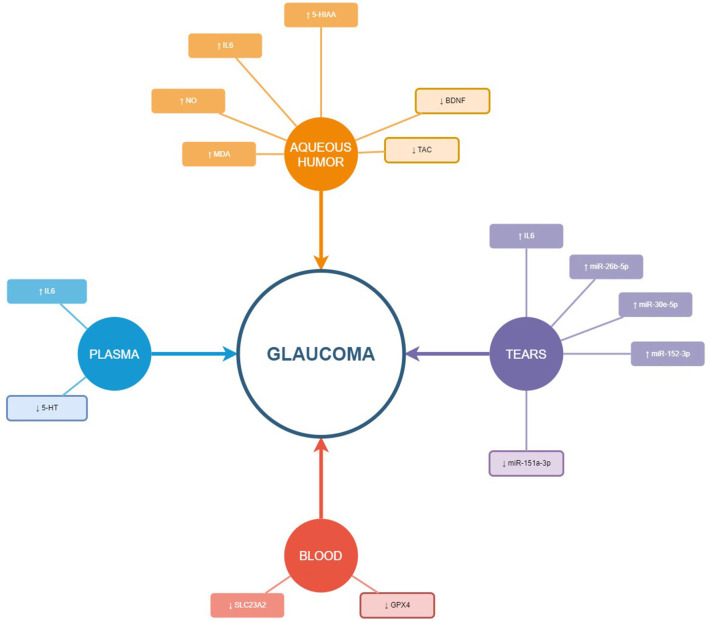
Figure 8.
Schematic illustration of the biomarkers studied in the different samples (aqueous humor, tears, plasma, and blood). The up-arrow shows over expression and the down-arrow under expression of the biomarker in glaucoma compared to control or comparative group. The miRNA included in this figure are those 4 with significantly different expression between groups and higher area under the curve.

