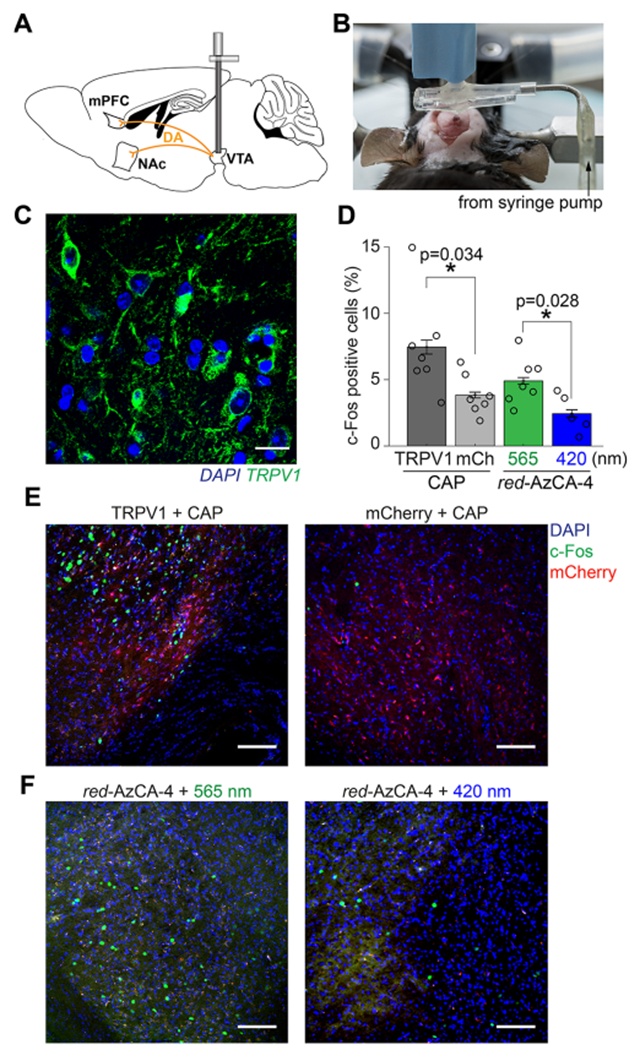
Figure 3.

In vivo chemogenetic stimulation of midbrain dopaminergic circuits. (A) Schematic of VTA dopamine projections to the mPFC and NAc. (B) Image displaying the craniotomy procedure while simultaneously injecting virus and implanting the probe. (C) Six weeks following viral injection and device implantation, immunofluorescence imaging using an anti-TRPV1 antibody confirmed TRPV1 expression (green) in the VTA. Brain slices were co-stained with the DAPI nuclear marker (blue). Scale bar = 10 μm. (D) Quantification of c-Fos expression in the VTA following injection of CAP or red-AzCA-4 (with 565 or 420 nm irradiation) over multiple animals (TRPV1 + CAP, N = 7; mCherry, N =7; red-AzCA-4 + 565 nm light, N = 7; red-AzCA-4 + 420 nm light, N = 5). (E) Injection of CAP (10 μM) caused an increase in c-Fos expression (green nuclei) in the TRPV1-expressing VTA neurons (left panel) when compared to those expressing mCherry only (right panel). (F) Injection of red-AzCA-4 (1 μM) caused increased c-Fos expression in the VTA when paired with 565 nm light (left panel) as compared to 420 nm light (right panel). Scale bar = 100 μm. Error bars = mean ± SEM.
