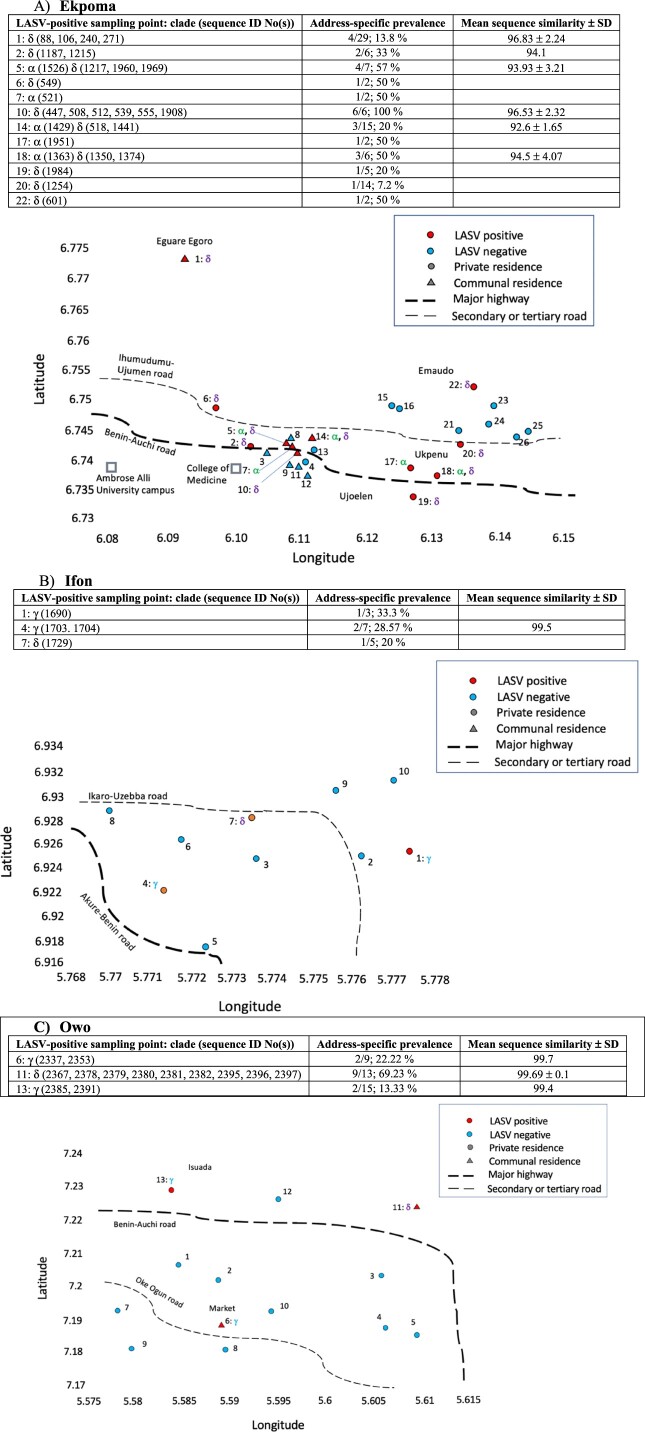
Figure 3.
Fine-scale LASV clade distribution within the larger-sized localities. Serial numbers represent sampling points (1–26 for Ekpoma, 1–10 for Ifon and 1–13 for Owo). Red sampling points within each map indicate where LASV-positive Mastomys were captured, with corresponding virus clades beside the sampling point number (e.g. 1: α, β, γ). Above each locality map appear details concerning the distribution of LASV sequences among sampling points and clades (e.g. 1: δ (88, 97, 109, 240, 271)), the virus prevalence in Mastomys at each LASV-positive address, and the mean sequence similarity. Circular sampling points denote private residences, and triangles communal residences. Data from 2011 to 2012 [25,29] are included for Ekpoma.

