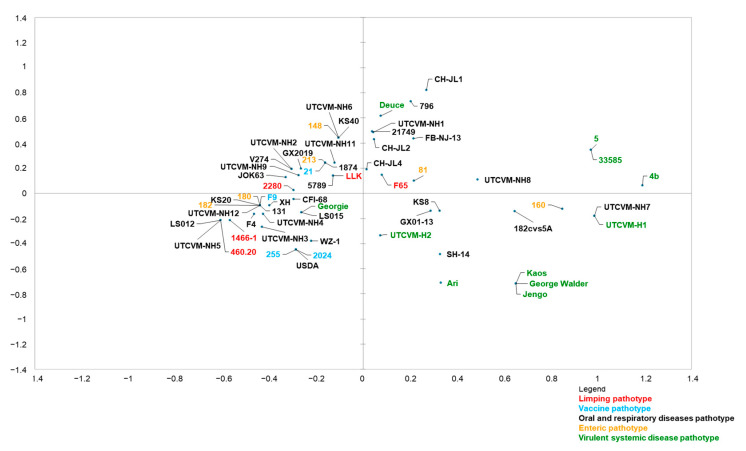
Figure 4.
MCA graph. The graph presents the sequences sorted after MCA analysis on the basis of the 14 residue properties of the region E domain of the capsid of strains 460.20/ITA/2020 identified in this study. The horizontal axis differentiates limping (red), oral respiratory disease (black), vaccine (blue), enteric (orange), and virulent systemic disease (green) strains.

