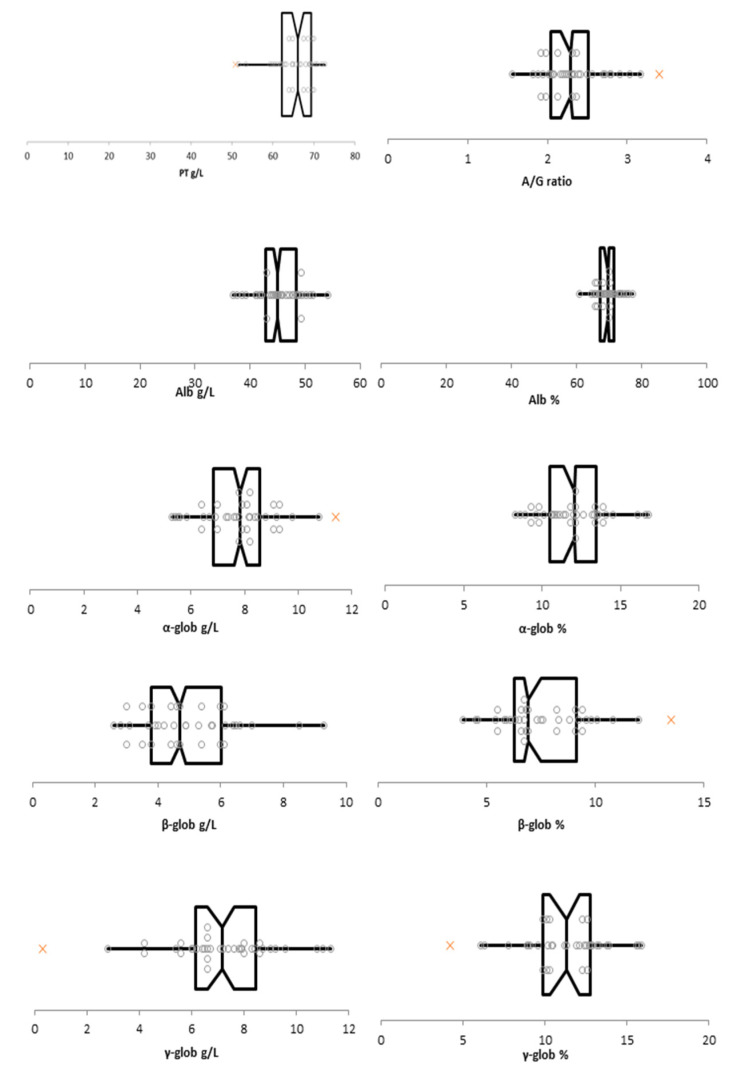
Figure 2.
Box-plot of data for the total protein, albumin/globulins ratio, albumin (g/L and %) α-globulins (g/L and %), β-globulins (g/L and %), and γ-globulins (g/L and %). The box represents the interquartile range (IQR) defined by the 25th (Q1) and 75th (Q3) percentiles with the vertical line representing the median. The horizontal lines are the limits of outliers’ distribution according to Tukey rule. Suspected outliers are indicated with orange x. Abbreviations: PT: total protein; A/G ratio: albumin-to-globulin ratio; Alb: albumin; α-glob: α-globulins; β-glob: β-globulins; γ-glob: γ-globulins.

