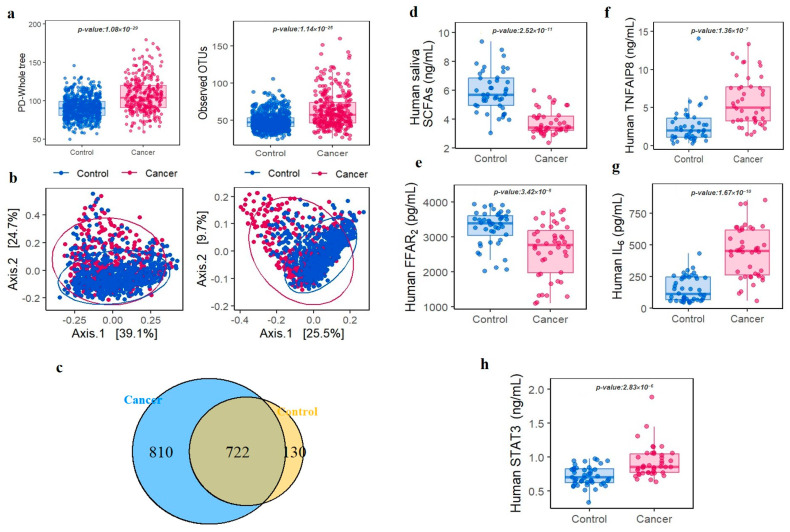
Figure 3.
Analysis of oral microbiota diversity, SCFAs, FFAR2, and cytokine levels in the control and cancer groups. Alpha diversity was estimated via the phylogenetic diversity whole tree (OTUs, p < 0.001) and by observing operational taxonomic units (p < 0.001) (a); Beta diversity was calculated using principal coordinate analyses based on weighted (p < 0.001) and unweighted (p < 0.001) UniFrac distances in oral microbiota communities (b); Venn diagrams showing overlaps between groups at the genus level (c); Oral saliva total short-chain fatty acid concentrations (d); Free fatty acid receptor 2 concentrations in oral saliva (e); Concentrations of human plasma TNF-α induced protein 8 (f); Human plasma interleukin-6 levels (g); Human plasma signal transducer and activator of transcription 3 levels (h).

