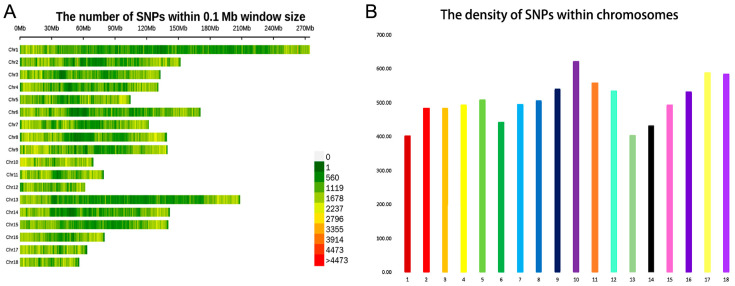
Figure 1.
The distribution of SNPs detected in Tunchang pigs across chromosomes. (A) Genome-wide distribution of detected SNPs on 18 autosomes chromosomes for Tunchang pigs. The X-axis represents the number of SNVs (single-nucleotide variants). The Y-axis represents 18 autosomes chromosomes, calculated as the number of SNPs per 0.1 Mb. (B) Genome-wide density distribution of detected SNPs on 18 autosomes chromosomes for the Tungchang pigs. The X-axis represents 18 autosomes chromosomes. The Y-axis represents the number of SNPs per 0.1 Mb on a chromosome.

