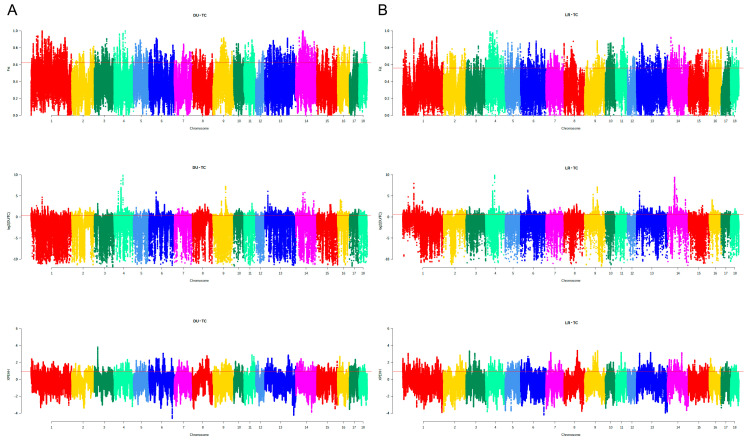
Figure 5.
Genome-wide putatively selective signatures by FST, θπ, and XP-EHH on 18 autosome chromosomes in the TC, DU, and LR populations. (A) Manhattan plot of weighted values of three methods between TC and DU. (B) Manhattan plot of weighted values of three methods between TC and LR. The X-axis represents 18 autosome chromosomes, and the Y-axis represents the weighted values of each method. Above the red line is the selected top 5% level.

